Podcast listener retention measures how successfully a show keeps people listening. It can describe how much of one episode listeners consume or how many listeners return for future episodes.
Strong retention usually suggests that an episode met the audience’s expectations and held their attention. Weak retention can reveal problems with the opening, pacing, structure, topic, audio quality, or the promise made by the title.
However, retention is not one universal number. Apple Podcasts, Spotify, YouTube, and podcast hosting platforms may use different metrics and definitions. To analyze it correctly, you need to know what each number represents, compare similar episodes, and examine patterns rather than reacting to one data point.
What Is Podcast Listener Retention?
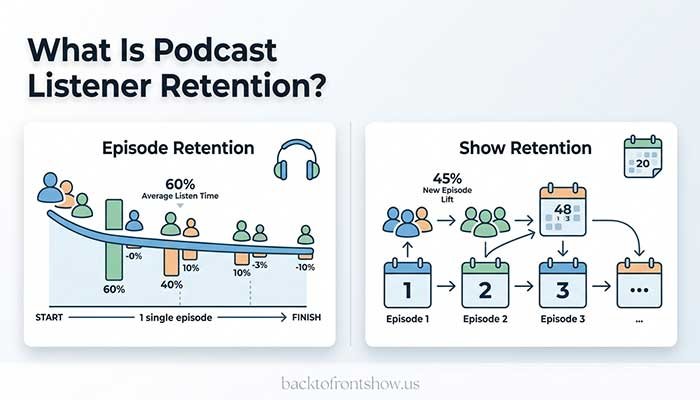
Podcast listener retention is the ability of a podcast or episode to maintain its audience over time.
The term commonly refers to two related but different behaviors:
- Episode retention: How much of a particular episode people consume before leaving or reaching the end.
- Show retention: How many people return to listen to additional episodes over days, weeks, or months.
These answer different questions.
Episode retention tells you whether an individual piece of content held attention. Show retention tells you whether the podcast is building an ongoing relationship with its audience.
For example, a listener could finish one episode but never return. That would be strong episode retention but weak show retention. Another listener might hear only half of each episode but return every week. That listener shows consistent loyalty even without a high completion rate.
Why Listener Retention Matters
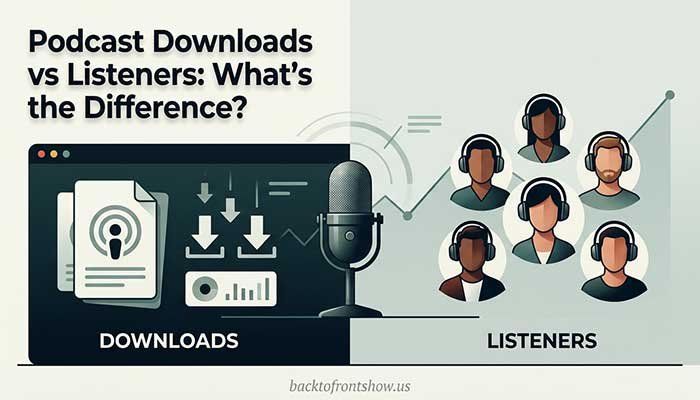
Download numbers tell you how widely an episode file was delivered under your provider’s measurement rules. They do not prove that every recipient listened to the full episode.
Retention gives you more context. It can help you understand:
- Whether the opening kept people interested
- Where listeners skipped or stopped
- Which segments held attention
- Whether episode length fits the content
- Which formats work best for your audience
- Whether listeners return for future releases
- Where to place important information or calls to action
- Whether a popular episode also delivered a satisfying experience
The IAB Tech Lab’s podcast measurement guidelines explain why podcast delivery is often measured through server logs. Listening applications that control playback can provide additional consumption data, but your hosting dashboard’s download total and a platform’s retention report measure different things.
In my experience, looking at downloads without retention creates an incomplete picture. An episode can attract a large initial audience because of a strong guest or title, yet lose many of those people early. Another episode may reach fewer listeners but hold their attention and generate a better response.
Podcast Retention Metrics Explained
Several metrics can help you evaluate retention. Their names may sound similar, but they shouldn’t automatically be treated as interchangeable.
| Metric | What it helps measure | Main limitation |
|---|---|---|
| Average consumption | The average percentage of an episode consumed | Replays and platform-specific calculation rules can affect the result |
| Average listening time | The average amount of time people spent listening | Longer episodes may produce more minutes without stronger percentage retention |
| Completion rate | The share of qualifying listeners who completed an episode under the platform’s rules | “Completed” may be defined differently across services |
| Retention curve | How the remaining audience changes across the episode timeline | Usually reflects only one platform’s users |
| Engaged listeners | Listeners who pass a platform-specific engagement threshold | The threshold is not universal |
| Returning audience | People who return to the show over a later period | This measures show loyalty, not completion of one episode |
| Time listened | Total listening time generated by an episode or show | A large audience can raise the total even when individual retention is weak |
Average consumption
Average consumption expresses listening as a percentage of the episode.
A simplified calculation is:
Average consumption = Average time consumed ÷ Episode duration × 100
Imagine a hypothetical 40-minute episode with an average listening time of 28 minutes:
28 ÷ 40 × 100 = 70%
The estimated average consumption is 70%.
This simple formula is useful for understanding the concept, but use the number reported by your platform when evaluating actual performance. A platform may account for replays, skips, qualifying activity, and other behavior differently.
Apple defines Average Consumption as the average percentage of an episode played per device based on consumption and episode duration. According to Apple Podcasts for Creators, the number can exceed 100% when someone listens to an episode more than once.
Podcast completion rate
Completion rate generally indicates how many qualifying listeners reached the end of an episode or satisfied the platform’s completion rule.
A simplified formula is:
Completion rate = Completed listens ÷ Qualifying starts × 100
For example, imagine 800 qualifying listeners started an episode and 480 completed it under the platform’s rules:
480 ÷ 800 × 100 = 60%
The hypothetical completion rate is 60%.
This calculation should not be used to recreate a platform’s metric unless the service provides the same definitions for starts and completions. Use it as a conceptual explanation.
Spotify reports episode completion information in Spotify for Creators. Its engagement analytics documentation says the completion chart compares recent episodes using their first seven days after publication. Spotify also displays an average line across recent episodes, which is more useful than judging one number in isolation.
Listener-retention curve
A retention curve shows how the audience changes as an episode progresses.
At the beginning, the line typically represents the initial audience. As people stop listening or skip portions, the curve may gradually decline or show more noticeable drops. Replays and repeated visits can create spikes in platforms that track them.
The shape of the curve often gives you more useful information than one completion percentage because it shows where behavior changed.
Engaged listeners
“Engaged listener” is a platform-defined term, not a general industry standard.
Apple currently defines an engaged listener as someone who listened to or watched at least 20 minutes or 40% of an episode. Apple Podcasts Connect also provides listeners, plays, time listened, and average consumption.
A short episode and a long episode can therefore reach the engagement threshold differently. Always check the platform’s current definition before reporting this metric to advertisers or comparing it with another service.
Returning audience
Returning-audience metrics help you evaluate retention across releases rather than within one episode.
Spotify’s engagement analytics includes returning audience and week-over-week retention. These metrics help answer whether people who consumed the show during one period returned in the next.
A returning audience is especially important for recurring podcasts. A highly shared episode may create a temporary traffic spike, but regular returning listeners provide a more stable foundation for growth.
Podcast Retention Rate vs. Completion Rate
These phrases are sometimes used as if they mean the same thing, but they can describe different measurements.
- Retention rate may refer to the percentage of the audience remaining at a particular moment, average consumption across the episode, or the proportion of listeners returning over time.
- Completion rate generally focuses on the share that reached the end or met a platform’s completion condition.
Suppose a hypothetical episode starts with 1,000 listeners:
- 850 remain after five minutes.
- 700 remain at the halfway point.
- 500 reach the end.
The retention rate at five minutes is 85%, the midpoint retention is 70%, and the simplified completion rate is 50%.
A single “retention rate” cannot describe that entire pattern. When sharing data, name the exact metric and the point or period being measured.
Where to Find Listener-Retention Data
Apple Podcasts Connect
Apple Podcasts Connect focuses on listening behavior within Apple Podcasts.
Its episode analytics can include:
- Listeners
- Engaged listeners
- Plays
- Time listened
- Average consumption
- Episode-level listening behavior
Apple also allows creators to compare performance over equal periods after release, including 7, 14, 30, and 60 days.
If your show is small, some information may not appear. Apple’s data requirements documentation says at least five unique users must play the content within the selected period for the applicable analytics metric.
Spotify for Creators
Spotify for Creators provides Spotify-specific engagement and episode analytics.
Depending on the content and account, these can include:
- Consumption time
- Average consumption time
- Completion rate
- Returning audience
- Week-over-week retention
- Comments
- Followers
- Episode benchmarks
Spotify’s episode analytics documentation says its benchmarks compare an episode with recent episodes using the median as the center of the normal range. At least 10 published episodes are required before these benchmarks appear.
Remember that Spotify engagement data reflects listening or viewing on Spotify. It should not be presented as behavior across your entire audience.
YouTube Studio
For video podcasts and podcasts distributed through YouTube, the audience-retention report shows how well different moments held viewers’ attention.
YouTube identifies several useful patterns:
- Flat sections where viewers continued watching
- Gradual declines
- Spikes associated with rewatching or sharing
- Dips where viewers skipped or stopped
- The percentage remaining after the first 30 seconds
According to YouTube Help, retention information normally takes one or two days to process. Highlighted key moments require a video of at least 60 seconds with at least 100 views, although detailed reporting availability can depend on the video and account.
YouTube is measuring viewing behavior on its own platform, so compare YouTube episodes with other YouTube episodes rather than combining these figures with Apple or Spotify percentages.
Your podcast hosting provider
Your host may report downloads, listeners, locations, devices, and listening applications. Some hosts also provide consumption data when they control the player.
Check your provider’s documentation carefully. A traditional host can measure media-file delivery across apps, but it may not be able to see every action a listener takes after the file is downloaded.
How to Analyze a Podcast Retention Graph
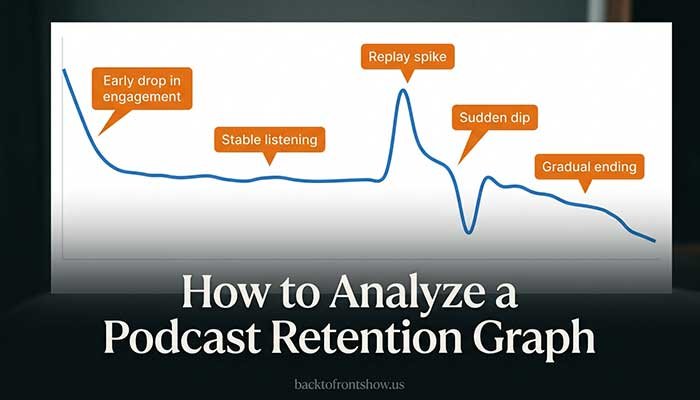
A retention graph is most useful when you connect changes in the line to specific moments in the episode.
1. Check the opening
Look at the first 30 seconds, first minute, and first few minutes.
A steep early decline may suggest:
- The introduction is too long
- The episode takes too long to deliver value
- The title promised something the opening didn’t address
- An advertisement or announcement appeared too early
- New listeners lacked enough context
- The recording quality caused people to leave
Some early decline is normal because not everyone who starts will continue. The important question is whether the loss is unusual compared with similar episodes.
2. Mark major segments on the timeline
Note the time of:
- The opening hook
- Host introductions
- Guest introductions
- Advertisements
- Topic changes
- Recurring segments
- Calls to action
- The main answer or takeaway
- The closing
Then match these timestamps with visible dips, spikes, or stable sections.
This makes the graph easier to interpret. Instead of saying, “People left around minute 18,” you can observe that the decline occurred during a seven-minute background section or immediately after the conversation changed subjects.
3. Look for sudden dips
A sharp dip can mean listeners:
- Skipped a section
- Stopped listening
- Jumped to a later chapter
- Lost interest after the main question was answered
A dip does not prove the content was bad. A practical tutorial may lose listeners once they receive the answer they needed. A segment could also serve a smaller but highly valuable part of the audience.
Use the graph to identify what deserves review, not to declare a cause without evidence.
4. Investigate spikes
A spike may indicate that people replayed or shared a section. It can also mean the explanation was difficult and had to be heard again.
YouTube’s official retention guidance specifically notes both possibilities. The right interpretation depends on what happened at that point.
Review the content and ask:
- Was there an especially useful statement?
- Did the guest tell a memorable story?
- Was a complicated process explained?
- Did people jump directly to this timestamp?
- Could this section become a short clip or separate episode?
5. Examine the ending
A gradual decline near the end is not automatically a problem. Listeners may leave after receiving the main value, during credits, or when the closing becomes predictable.
However, if you place your only call to action in the final minute and much of the audience has already left, the data may support moving it earlier.
6. Compare, don’t isolate
Compare the episode with others that have similar:
- Length
- Format
- Topic
- audience
- Release timing
- Promotional support
A 15-minute news update should not be judged against a two-hour interview. Different formats create different listening behavior.
I’ve found that retention becomes much more useful when you stop asking, “Is this percentage good?” and start asking, “Is this stronger or weaker than our usual result for this type of episode?”
Read More: 7 Best Podcast Analytics Tools in 2026 (Free & Paid)
What Is a Good Podcast Retention Rate?
There is no trustworthy universal retention rate that every podcast should reach.
Results are affected by:
- Episode length
- Format
- Category
- Listener intent
- Release schedule
- Platform
- Whether the audience is new or returning
- How the platform defines the metric
- Whether listeners replay, skip, or download automatically
A completion rate that is normal for a short daily update may not be realistic for a long narrative series or a multi-hour interview.
The most useful benchmark is usually your own podcast’s recent performance. Compare episodes of a similar type over the same number of days after release.
Use the median when possible. One viral episode can pull an average upward and make normal releases appear weaker than they really are.
For a beginner, I’d recommend creating separate baselines for:
- Solo episodes
- Interviews
- Short updates
- Long-form episodes
- Bonus content
- Video episodes
This produces more meaningful comparisons than putting every release into one group.
How to Improve Podcast Listener Retention
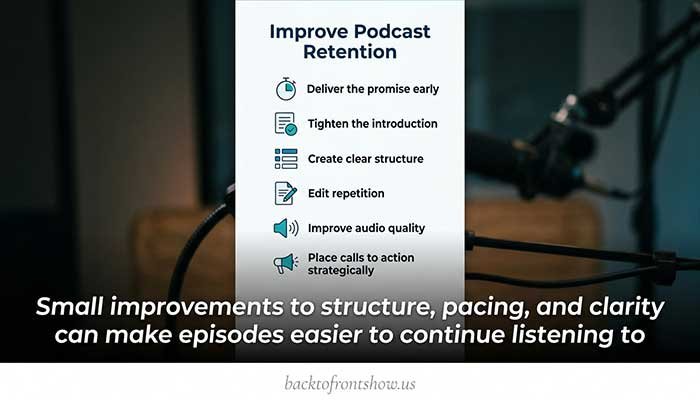
Deliver the promise early
Tell listeners what they will learn or experience and begin providing it quickly.
If the title promises “How to Book Better Podcast Guests,” don’t spend eight minutes discussing unrelated news before addressing guest outreach.
Shorten the runway
An introduction should earn attention, not simply fill time.
Consider reducing:
- Repeated show descriptions
- Long host biographies
- Unnecessary previews
- Multiple announcements
- Extended music
- Explanations regular listeners already know
This doesn’t mean every introduction must be extremely short. It means each part should help the listener understand why the episode is worth continuing.
Improve structure
Give the episode a clear path.
For educational content, that could be:
- Explain the problem.
- Define the essential terms.
- Walk through the solution.
- Give an example.
- Explain common mistakes.
- End with a practical next step.
For an interview, organize questions into themes rather than following every possible tangent.
Edit repetition
Listeners will tolerate natural conversation, but repeated points can weaken momentum.
During editing, ask:
- Has this idea already been explained?
- Does this tangent help the main topic?
- Can this answer be tightened without losing meaning?
- Is the transition clear?
- Is the listener still receiving new value?
Use signposting
Simple phrases help listeners follow longer episodes:
- “There are three parts to this.”
- “Now that we’ve covered the cause, let’s look at the solution.”
- “Here’s the practical example.”
- “The final mistake is the one that causes the most confusion.”
Signposting is particularly useful when listeners are multitasking and cannot see a visual outline.
Place calls to action strategically
Don’t automatically save every important action for the last few seconds.
If retention consistently declines before the ending, place the most relevant call to action after a high-value segment. Keep it brief and directly connected to the episode.
A listener who just heard a useful explanation is more likely to understand why the related worksheet, newsletter, or resource matters.
Match the length to the content
A longer episode is not necessarily worse, and a shorter episode is not automatically more engaging.
The right length is the time needed to deliver the promised value without unnecessary repetition. If the subject needs 50 minutes, forcing it into 20 may make it shallow. If it needs 15 minutes, stretching it to an hour can weaken retention.
Improve technical quality
People may leave when speech is difficult to understand.
Check for:
- Low volume
- Large volume differences between speakers
- Background noise
- Echo
- Distortion
- Uncomfortable music levels
- Unedited connection problems
Clear audio will not rescue weak content, but distracting audio can damage strong content.
Create better transitions
Abrupt changes can make an episode feel disorganized. Briefly explain why the next segment matters and how it connects to the main subject.
Study your strongest moments
Improvement isn’t only about fixing dips. Look for sections where retention stays unusually stable.
Ask what those moments have in common:
- A specific story
- A practical example
- A direct answer
- A strong guest response
- A useful checklist
- A surprising but relevant point
Then use those qualities more deliberately in future episodes.
A Practical Retention Review Process
Use this process after each episode has had enough time to collect meaningful data.
Step 1: Record the context
Write down the topic, format, duration, release date, promotion, and intended audience.
Step 2: Select a consistent period
Compare the first 7 days with the first 7 days of other episodes, or the first 30 days with the first 30 days.
Step 3: Record core metrics
Track:
- Average consumption
- Average listening time
- Completion rate
- Returning audience, if available
- Important dips or spikes
- Downloads, listeners, plays, or views for context
Step 4: Compare similar episodes
Use episodes with a similar length and format. Prefer your median result over your single best episode.
Step 5: Review the timeline
Listen again to the sections where the graph changed noticeably.
Step 6: Form a hypothesis
Examples:
- “The long guest introduction may have contributed to the early decline.”
- “The practical example appears to have held attention.”
- “Listeners may have skipped the repeated promotional segment.”
Use “may” until you have repeated evidence or listener feedback.
Step 7: Choose one change
Test one meaningful adjustment in a future episode, such as a shorter opening or earlier example.
Step 8: Evaluate a pattern
After several comparable releases, check whether the change corresponded with better results.
Example of a Retention Analysis
Imagine a hypothetical weekly personal-finance podcast with 40-minute episodes.
A new episode shows:
- Strong initial reach
- A noticeable decline during a six-minute introduction
- Stable retention during a step-by-step budgeting example
- A spike when the guest explains how to automate savings
- Another drop during a long promotional message
- Few listeners remaining for the closing call to action
A reasonable analysis would be:
- The topic and promotion successfully attracted attention.
- The introduction may be delaying the value.
- Practical examples appear to hold the audience.
- The savings-automation section may be useful, memorable, or difficult enough to replay.
- The promotion may be too long or poorly placed.
- The call to action may need to appear earlier.
The next episode could test a two-minute opening, introduce the first example sooner, shorten the promotion, and place the main call to action after a high-value section.
That is more useful than simply labeling the retention rate “good” or “bad.”
Read More: How to Analyze Podcast Episode Performance
Common Listener-Retention Mistakes
Chasing a universal benchmark
A general online benchmark may not match your format, episode length, category, audience, or platform definition. Your own comparable episodes provide better context.
Comparing different platforms directly
A Spotify completion percentage and Apple average consumption are not necessarily calculated the same way. Analyze each platform’s trends separately.
Assuming every drop is negative
Listeners may skip an advertisement, leave after receiving an answer, or return later. A decline identifies a point to investigate; it does not explain the listener’s reason.
Ignoring episode length
Listening for 30 minutes can represent excellent consumption on a 35-minute episode and weaker consumption on a two-hour episode. Review both time and percentage.
Changing too many things at once
If you alter the length, opening, format, release day, guest type, and promotional strategy together, you won’t know which change mattered.
Treating small samples as certainty
A few listeners can produce an unstable-looking graph. Wait for enough data and focus on repeated patterns.
Optimizing away the show’s personality
Editing every pause, story, or side conversation can make a podcast feel unnatural. Retention should guide editorial judgment, not replace it.
Key Takeaways
Podcast listener retention shows how well an episode holds attention and how consistently people return to the show.
To use it effectively:
- Separate episode retention from returning-audience retention.
- Understand each platform’s definitions.
- Compare similar episodes over equal periods.
- Use retention curves to identify moments worth reviewing.
- Treat dips and spikes as clues, not proof.
- Avoid universal benchmarks.
- Make one practical change and evaluate the pattern over several episodes.
What I’ve learned is that retention data becomes valuable only when it changes what you do. The goal isn’t to create a perfect graph. It’s to understand your listeners well enough to produce clearer, more useful episodes.