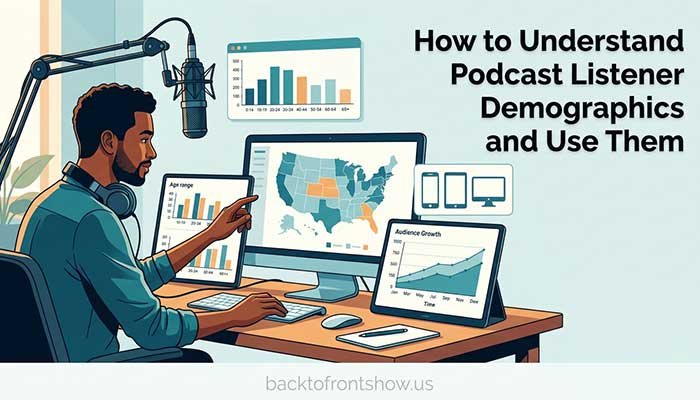
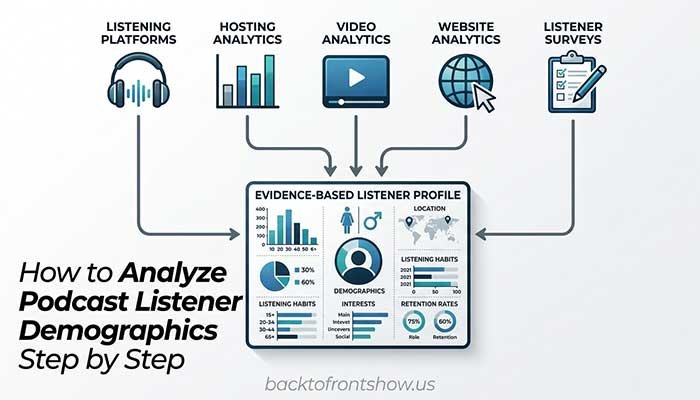
Podcast listener demographics describe measurable characteristics of your audience, such as age range, gender distribution, location, language, and device use. You can find parts of this information in Spotify for Creators, YouTube Studio, Apple Podcasts Connect, your hosting dashboard, website analytics, and voluntary listener surveys.
The important part isn’t simply collecting the data. You need to understand what each platform measures, recognize what’s missing, and connect the information to real decisions about your content, promotion, monetization, and audience growth.
No single dashboard gives you a complete picture. Each platform represents a different part of your audience, and privacy protections may limit the information available. A useful podcast audience profile therefore combines several sources without pretending the data is more precise than it is.
What Are Podcast Listener Demographics?
Podcast listener demographics are broad characteristics used to describe the people who listen to a show.
Common demographic categories include:
- Age range
- Gender
- Country
- State or region
- City
- Language
- Education
- Occupation
- Household income
- Family or relationship status
Podcast platforms normally provide only some of these categories. Age, gender, location, platform, and device data are more commonly available. Information such as occupation, education, income, purchasing authority, and family status usually requires a voluntary survey or another direct source.
Demographics tell you who is listening. They don’t fully explain why those people listen, what problems they face, or what they want from the show.
For that, you also need psychographic and behavioral information.
Demographics, Psychographics, and Listener Behavior
These three types of information answer different questions.
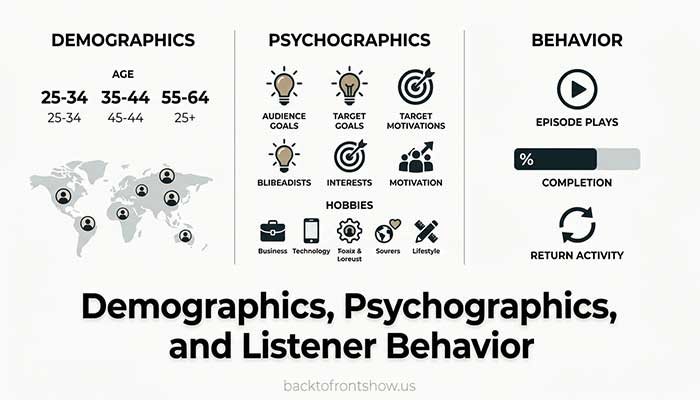
| Data type | What it describes | Examples |
|---|---|---|
| Demographics | Who listeners are | Age range, gender, location, language |
| Psychographics | What listeners care about | Goals, values, interests, motivations, concerns |
| Behavior | What listeners do | Episodes played, completion, return frequency, clicks, sign-ups |
| Feedback | What listeners directly tell you | Survey answers, reviews, emails, comments |
Imagine a hypothetical personal-finance podcast.
Its platform data may show that much of the audience is 25–34 and located in major US cities. That is demographic information.
A listener survey may reveal that many respondents are trying to pay off student loans while saving for a home. That is psychographic information.
Analytics may show that episodes about credit scores and first-time homebuying receive high completion and sharing rates. That is behavioral information.
Together, these findings are much more useful than age and location alone.
In my experience, the strongest audience profiles combine what analytics show with what listeners actually say. Demographic charts provide useful direction, but direct feedback supplies the context that numbers often lack.
Read More: Podcast Listener Retention Explained
Why Podcast Audience Demographics Matter
Audience insights can support several practical decisions.
Choosing useful topics
If you understand your listeners’ life stage, location, professional situation, and priorities, you can choose topics that address more relevant problems.
For example, a career podcast with a large audience of early-career professionals may focus on first promotions, salary negotiations, skill development, and workplace communication. A show serving experienced executives would need a different editorial approach.
Improving how you explain ideas
Audience data can influence vocabulary, examples, pacing, and the amount of background information you provide.
This doesn’t mean making assumptions about individuals. It means noticing broad audience patterns and testing whether certain approaches improve engagement.
Selecting promotional channels
Different audience groups may discover content through different platforms, searches, newsletters, communities, or video formats.
Device and platform data can also guide how you package content. A large YouTube audience may justify more attention to thumbnails and video presentation. A strong audio-app audience may respond better to feed swaps, podcast guest appearances, or in-app promotion.
Creating stronger sponsorship proposals
Potential sponsors often want to know whether a show reaches people who are relevant to their offer.
Useful information may include:
- Audience location
- Broad age distribution
- Relevant interests
- Occupation or industry
- Purchasing responsibilities
- Engagement
- Survey-based intent
Be precise about the source. Don’t present a survey of 100 voluntary respondents as if it represents every listener with certainty.
Improving products and calls to action
Demographic information becomes more useful when combined with listener needs.
Knowing that listeners are between 25 and 34 doesn’t tell you what to sell them. Knowing that many survey respondents are first-time business owners who struggle with bookkeeping offers a clearer direction for content, resources, or partnerships.
Where to Find Podcast Listener Data
Spotify for Creators
Spotify for Creators provides one of the more direct sources of podcast audience demographics.
According to Spotify’s Audience analytics documentation, available breakdowns can include:
- Locations
- Platforms
- Apps and devices
- Gender
- Age
- New audience
- Returning audience
There are important boundaries:
- Age and gender come from Spotify activity.
- Location can include Spotify and all-platform information for shows hosted with Spotify for Creators.
- App and device data across platforms is available for shows hosted with Spotify for Creators.
- Availability may depend on how and where the show is hosted.
- Spotify notes that some analytics can take as long as 48 hours to refresh.
Use these reports to identify broad patterns. Avoid assuming that Spotify’s age and gender distribution represents listeners using Apple Podcasts, YouTube, or other apps.
Apple Podcasts Connect
Apple Podcasts Connect provides listening and location information for Apple Podcasts activity.
Apple’s analytics documentation includes country or region and city information. Creators can also analyze listeners, engaged listeners, plays, time listened, follow status, and episode performance.
Apple does not currently provide the same age-and-gender breakdown described in Spotify’s audience dashboard. Use Apple primarily for geographic and behavioral insights rather than trying to create a complete demographic profile from it.
Apple also uses minimum reporting thresholds. At least five unique listeners must play content within the selected period for the relevant analytics metric to appear. Some downloadable listening reports use additional privacy measures, including thresholds and small amounts of statistical noise, according to Apple’s privacy documentation.
Missing information therefore doesn’t necessarily mean an audience segment doesn’t exist. The segment may simply be too small to display.
YouTube Studio
For video podcasts or audio podcasts distributed through YouTube, the Audience tab in YouTube Studio can provide:
- Age ranges
- Gender distribution
- Top geographies
- Subtitle or closed-caption languages
- Device types
- New, casual, and regular viewers
- Other channels and content the audience watches
- Times when viewers are active on YouTube
YouTube’s audience documentation explains that some demographic information, including geography and gender, may be limited.
YouTube also calculates monthly audience as a rolling estimate of unique viewers during the previous 28 days. It divides the audience into new, casual, and regular viewers based on viewing behavior.
If a channel publishes podcasts, Shorts, livestreams, and unrelated videos, channel-level demographics may represent all that content. Filter or compare content carefully before treating the results as your podcast’s profile.
Your podcast hosting provider
Hosting dashboards often provide some combination of:
- Countries
- Regions or cities
- Listening applications
- Devices
- Operating systems
- Download history
- Episode popularity
Your host may be the best source for broad distribution information across podcast apps, but it may not know a listener’s age, gender, occupation, or motivation.
Review the host’s documentation before interpreting “listeners,” “downloads,” or location. These metrics can be calculated differently across providers.
Website analytics
If your podcast sends people to a website, website analytics can add information about visitors who follow that path.
Google Analytics can report dimensions such as country, region, city, language, and—when the necessary signals and consent are available—age, gender, and interests.
However, Google’s demographic reporting documentation states that this information may cover only a subset of users. Privacy thresholds may also hide results when user counts are low.
Website visitors are not identical to podcast listeners. Someone may listen without ever visiting your site, while another person may find an article through search without hearing the podcast.
Treat website analytics as another piece of evidence, not a replacement for podcast-platform data.
Listener surveys
A survey can collect information that platforms don’t provide.
Depending on your purpose, you might ask about:
- Age range
- General location
- Occupation or industry
- Role or seniority
- Education
- Interests
- Challenges
- Listening habits
- Favorite episode formats
- Purchase or decision-making responsibilities
- Topics listeners want covered
- How they discovered the show
Keep the survey focused. People are less likely to finish a long questionnaire filled with questions that don’t clearly benefit them or the show.
Explain why you are collecting the information, how it will be used, and whether responses are anonymous. Avoid requesting sensitive personal information unless it is truly necessary and you are prepared to handle it appropriately.
Read More: How to Analyze Podcast Episode Performance
How to Analyze Podcast Listener Demographics Step by Step
Step 1: Start with a clear question
Don’t open every dashboard and collect numbers without a purpose.
Decide what you need to learn. For example:
- Which US regions contain the most listeners?
- Are we reaching beginners or experienced professionals?
- Which age groups engage most with video episodes?
- Do our most loyal listeners differ from new listeners?
- Which audience characteristics matter to potential sponsors?
- Does the audience match the people the show intends to serve?
A clear question helps you select relevant data and ignore distractions.
Step 2: Choose a consistent date range
Use the same or closely matched reporting period where possible.
A Spotify report covering the last 30 days shouldn’t be casually compared with a YouTube report covering the lifetime of the channel. Seasonal topics, major guests, paid promotion, and one unusually popular episode can temporarily change the audience mix.
For an ongoing podcast, monthly and quarterly reviews usually provide more useful patterns than daily checks.
Step 3: Record the source of every number
Label each figure clearly.
Instead of writing:
42% of our audience is 25–34.
Write:
During the selected period, 42% of the audience represented in Spotify’s age report was 25–34.
The second statement is more accurate because it identifies the platform and scope.
A simple tracking table can help:
| Finding | Source | Period | Coverage or limitation |
|---|---|---|---|
| Largest age group | Spotify | Last 90 days | Spotify audience only |
| Top US states | Hosting dashboard | Last 90 days | Based on host-reported activity |
| Viewer gender distribution | YouTube Studio | Last 90 days | YouTube viewers; limited data may apply |
| Main professional challenges | Listener survey | Survey dates | Voluntary respondents only |
| Top website locations | Website analytics | Last 90 days | Website visitors, not all listeners |
Step 4: Check audience size and missing data
Small samples can produce unstable percentages.
If five people are represented in a segment, one person changes the result by 20 percentage points. A chart may look precise while still being too small to support a major decision.
Watch for:
- “Not enough data” messages
- Unknown or unreported categories
- Privacy thresholds
- Large percentages based on small totals
- Short date ranges
- Voluntary-response bias in surveys
- A viral episode that temporarily changed the mix
Expand the date range when appropriate, but don’t hide meaningful changes by combining unrelated periods.
Step 5: Compare sources without blending them
Place the findings side by side, but keep their boundaries visible.
For example:
- Spotify may provide age and gender for Spotify users.
- Apple may show strong listening in particular cities.
- YouTube may show a younger video audience.
- A listener survey may reveal occupations and goals.
- Website analytics may show which regions generate sign-ups.
These findings can all be true because the sources represent different groups and behaviors.
Don’t average percentages from different platforms unless you have compatible totals, matching definitions, and a valid reason to combine them.
Step 6: Add behavioral evidence
Demographics become useful when connected to actions.
Compare audience segments with:
- Episode topics
- Completion or consumption
- Returning audience
- Comments
- Poll responses
- Website visits
- Email sign-ups
- Resource downloads
- Purchases
- Event registrations
Suppose a hypothetical business podcast learns that the largest Spotify age group is 25–34. That alone doesn’t justify changing the entire content strategy.
But imagine that beginner-focused episodes also have stronger completion, receive more questions, and generate more newsletter sign-ups. The combined evidence offers a much stronger case for publishing additional beginner content.
Step 7: Ask listeners for context
Use a short survey, email question, community poll, or call for listener messages.
Helpful questions include:
- What are you trying to accomplish right now?
- What is your biggest challenge related to this topic?
- Which episode types help you most?
- When and where do you usually listen?
- How did you discover the show?
- What topic should the show cover next?
- What is your role or industry?
- Which US state or broad region do you live in?
Open-ended answers can reveal needs that age and location charts cannot.
Step 8: Build a practical audience profile
Summarize the most useful patterns rather than inventing a detailed fictional person.
A profile might say:
Available platform data suggests the show reaches primarily US listeners, with the largest represented Spotify age group between 25 and 34. Survey respondents frequently identify as early-career marketing professionals and small-business owners. Beginner tutorials and practical case discussions receive stronger completion and email response than broad industry-news episodes.
Notice the cautious wording:
- It identifies the source.
- It uses “suggests” rather than claiming certainty.
- It combines demographics, feedback, and behavior.
- It avoids pretending every listener is the same.
Step 9: Make one decision
Turn the analysis into an action.
Possible decisions include:
- Cover a recurring listener problem
- Add more beginner explanations
- Invite guests from an audience-relevant industry
- Create content for a strong geographic market
- Adjust examples for the audience’s professional context
- Publish additional video clips
- Change a call to action
- Approach sponsors that fit the documented audience
- Translate or caption video content when language data supports it
- Run a larger listener survey
Test the decision and measure what happens next.
How to Create a Podcast Audience Profile

A useful podcast audience profile should contain evidence, uncertainty, and practical meaning.
Include these sections:
1. Geographic profile
Record the leading countries, US states or regions, and cities when enough data is available.
Use location to inform:
- Local examples
- Event planning
- Release timing
- Regional guests
- Sponsorship fit
- Advertising geography
Location data is often estimated from technical signals and should not be treated as a verified home address.
2. Age and gender distribution
Use ranges and percentages reported by the platform. Record unknown or unavailable categories rather than removing them.
Don’t assume that every person in an age group has the same income, interests, life stage, or buying behavior.
3. Professional or life context
Collect this through voluntary surveys, email conversations, community discussions, or registration forms where appropriate.
Examples include:
- Student
- Early-career employee
- Manager
- Business owner
- Parent
- Hobbyist
- Industry specialist
Only collect information that helps you serve the audience.
4. Goals and challenges
This is often more actionable than demographic data.
Document recurring goals such as:
- Starting a podcast
- Growing an existing show
- Finding sponsors
- Improving audio
- Understanding analytics
- Building a business audience
5. Listening behavior
Include:
- Preferred episode formats
- Common listening platforms
- Devices
- Completion patterns
- Publishing frequency preferences
- New versus returning audience
- Discovery sources
6. Evidence and confidence
Label every conclusion as high, medium, or low confidence.
For example:
| Audience conclusion | Evidence | Confidence |
|---|---|---|
| The show has a substantial US audience | Multiple platforms show the US as the top country | High |
| Listeners prefer step-by-step episodes | Higher completion plus repeated survey comments | Medium to high |
| Most listeners are business owners | Small voluntary survey only | Low |
| The YouTube audience is younger than the audio audience | Separate platform age reports | Medium |
This prevents a weak signal from becoming an unsupported fact.
A Hypothetical Demographic Analysis
Imagine a weekly marketing podcast with listeners across audio platforms and YouTube.
Its hypothetical data shows:
- The United States is the largest country across the hosting dashboard and Apple Podcasts.
- Spotify’s largest represented age group is 25–34.
- YouTube viewers are more evenly divided between 18–24 and 25–34.
- Survey respondents frequently mention working at small businesses or marketing agencies.
- Episodes about practical campaign measurement retain more listeners than general marketing-news discussions.
- Tutorial videos receive more saves and website visits than interview clips.
A responsible conclusion would be:
The available evidence suggests a strong US audience of younger marketing professionals and small-business practitioners who respond well to practical measurement tutorials.
An irresponsible conclusion would be:
Every listener is a 29-year-old US agency employee with a high income.
The first conclusion is supported but cautious. The second invents precision that the data cannot provide.
Based on the evidence, the show might test:
- More practical analytics episodes
- Clearer beginner-to-intermediate labels
- Downloadable measurement templates
- Video demonstrations
- Sponsors serving small marketing teams
It should then measure whether these choices improve retention, response, or conversion.
Common Podcast Demographic Mistakes
Treating one platform as the entire audience
Spotify demographics describe Spotify users represented in its reports. YouTube data represents YouTube viewers. Neither automatically describes everyone who listens elsewhere.
Assuming demographic data explains motivation
Age and location don’t reveal what a listener needs. Combine demographic information with behavior and direct feedback.
Ignoring unknown or missing data
Unreported data is not the same as zero. Privacy thresholds, consent choices, insufficient activity, and unavailable identifiers can all limit reporting.
Using percentages without sample context
A percentage can look convincing even when it represents very few people. Include the audience count or sample size when it is available.
Overgeneralizing from survey respondents
People who complete a survey may be more engaged than the average listener. Describe the result as feedback from respondents, not a perfect census.
Building a fictional persona with unsupported details
A persona should summarize evidence, not become a creative-writing exercise. Don’t invent an income, job, family status, or motivation because it sounds plausible.
Collecting information without a reason
Every additional survey question creates friction and privacy responsibility. Collect only what supports a clear editorial, marketing, or business decision.
Using demographics to stereotype listeners
Demographics reveal broad patterns, not individual abilities, preferences, or values. Test ideas through behavior and feedback instead of relying on assumptions.
How to Use Demographic Insights Responsibly
A practical rule is to work with groups, not individuals.
Use aggregated information to improve:
- Topic selection
- Explanations
- Accessibility
- Promotion
- Sponsorship fit
- Community activities
- Product development
Avoid using limited data to infer sensitive characteristics or identify individual listeners.
When conducting a survey:
- Explain its purpose
- Keep participation voluntary
- Collect only necessary information
- Use age ranges instead of exact birth dates when possible
- Use broad locations unless city-level information is necessary
- Avoid requesting sensitive information casually
- Store responses securely
- Report findings in groups
- Review the privacy and consent requirements that apply to your situation
If you are collecting data for advertising, employment, health, financial, or other sensitive purposes, obtain appropriate legal or privacy guidance for your circumstances.
A Simple Monthly Audience Review
Use this checklist once a month or once per quarter:
- Review location across your host, Apple, Spotify, and YouTube.
- Record Spotify and YouTube age or gender data when available.
- Note platforms, apps, and devices.
- Separate new, returning, casual, or regular audience data.
- Check which topics and formats perform best.
- Review listener emails, comments, polls, and survey responses.
- Label every finding with its source and date range.
- Note missing data and small samples.
- Update the audience profile only when a pattern is supported.
- Choose one content or marketing decision to test.
I usually recommend keeping the profile short enough to use during planning. A five-page persona that no one checks is less valuable than a one-page summary tied to clear editorial decisions.
Key Takeaways
Podcast listener demographics can help you understand who is represented in your audience, but they are only one part of audience research.
For a more dependable picture:
- Combine several analytics sources.
- Keep platform audiences separate.
- Record the date range and source of every number.
- Look for missing, unknown, or privacy-limited data.
- Add behavioral information.
- Ask listeners about their needs and goals.
- Build evidence-based profiles without false precision.
- Turn each insight into a testable decision.
The goal isn’t to know every personal detail about every listener. It’s to understand the audience well enough to create more useful content while respecting the limits of the data.