The most useful podcast metrics are downloads, unique listeners or audience, plays, listener retention, average consumption, followers, engagement, traffic sources, and conversion metrics.
But you don’t need to obsess over every number in your analytics dashboard.
A better approach is to track a small group of podcast KPIs that tell you three things:
- Are more people discovering your podcast?
- Are they actually listening?
- Are enough of them coming back, following, subscribing, or taking another action?
Downloads alone can’t answer all three questions.
Apple Podcasts, Spotify, YouTube, and podcast hosting platforms now provide different types of audience and consumption data, which means creators can understand their performance in much more detail than simply asking, “How many downloads did this episode get?”
In my experience, the biggest mistake is treating one metric—usually downloads—as a complete measure of success. Downloads are important, especially for measuring distribution and comparing episode reach, but engagement and audience growth often tell you much more about whether the show itself is improving.
Here’s what to track and how to use each number.
Podcast Metrics at a Glance
| Podcast Metric | What It Tells You | Why It Matters |
|---|---|---|
| Downloads | How often episodes were downloaded | Useful for reach, trends, and sponsorship reporting |
| Unique listeners/audience | Approximate number of individual listeners | Helps estimate actual audience size |
| Plays | How often people actively started consuming an episode | Shows active consumption on supported platforms |
| Average consumption | How much of an episode people consume | Helps judge content quality and pacing |
| Audience retention | Where listeners or viewers stay or leave | Identifies strong and weak parts of an episode |
| Followers/subscribers | People choosing to stay connected | Measures audience loyalty |
| Engagement | Comments and other interactions | Shows active audience involvement |
| Impressions | How often your podcast was shown | Helps evaluate discoverability |
| Conversion rate | How often discovery leads to listening | Shows how effectively your presentation attracts listeners |
| Traffic/discovery sources | Where people find your show | Helps you decide where to promote it |
| Episode growth | Performance compared with past episodes | Shows whether the podcast is improving |
| Revenue/conversions | Business actions generated by the podcast | Essential when podcasting supports a business |
1. Podcast Downloads
Downloads are still one of the most widely used podcast performance metrics.
A download generally represents a qualifying request for an episode’s media file. Industry measurement standards exist to reduce duplicate requests, bots, and other traffic that could artificially inflate numbers.
The IAB’s podcast measurement framework has historically treated a qualifying podcast download as a filtered request associated with actual podcast delivery rather than simply counting every raw request to a media file.
Why podcast downloads matter
Downloads can help you:
- Compare one episode with another
- Measure overall audience growth
- See whether a guest or topic attracts more interest
- Evaluate promotion campaigns
- Provide audience numbers to potential advertisers
- Identify your strongest back catalog episodes
For most creators, your podcast hosting provider is the best place to see total downloads across listening platforms.
Apple makes an important distinction here: Apple Podcasts Connect focuses primarily on listening behavior inside Apple Podcasts, while your hosting provider may provide broader download information.
Don’t compare episodes unfairly
An episode published two days ago hasn’t had the same opportunity to accumulate downloads as one published six months ago.
Instead, compare equivalent periods such as:
- Downloads after 24 hours
- Downloads after 7 days
- Downloads after 30 days
This makes your comparisons much more useful.
Imagine your weekly podcast normally receives:
- 350 downloads in the first 7 days
- 500 downloads in the first 30 days
A new episode reaches 520 downloads within its first week.
That tells you much more than comparing its 520 downloads with an older episode that has accumulated 1,800 downloads over a year.
2. Unique Listeners or Audience
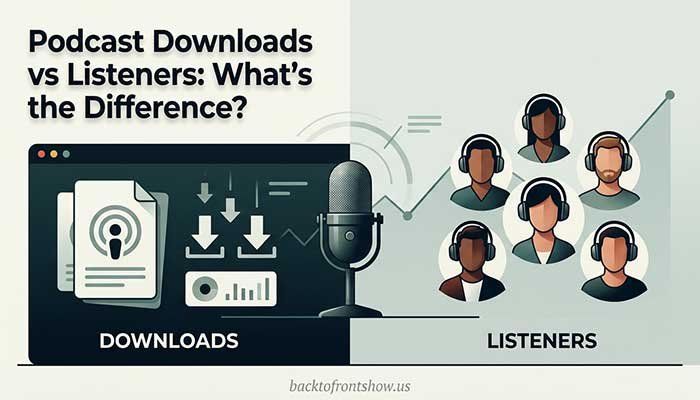
Downloads and listeners aren’t the same thing.
One person may download several episodes. A listener may also replay an episode or use more than one device.
That means total downloads can be much higher than the approximate number of people consuming your show.
Spotify, for example, defines its audience metric as the number of unique people who played or downloaded episodes during a selected period. Spotify also notes that audience will normally be lower than total plays and downloads because one person can consume multiple episodes.
Why this metric matters
Unique listener or audience data gives you a better sense of your real reach.
Suppose your show generates:
- 12,000 downloads in one month
- 3,500 unique listeners
Those numbers aren’t contradictory. They may simply indicate that many people listened to multiple episodes.
That’s usually valuable information because repeat consumption can indicate loyalty.
3. Plays
A play usually tells you that somebody actually started consuming your content on a particular platform.
However, definitions vary.
Spotify currently counts a play when an episode has been watched or listened to for at least 30 seconds on Spotify.
Apple Podcasts defines Plays as the total number of episode plays with a duration greater than zero seconds.
Because platforms define metrics differently, don’t automatically compare an Apple “play” with a Spotify “play” as though they were identical.
What to do instead
Use each platform’s data mainly to compare:
- Your Spotify episodes against other Spotify episodes
- Your Apple episodes against other Apple episodes
- Your YouTube episodes against other YouTube episodes
Consistency matters more than forcing different platforms into one number.
4. Average Consumption
Getting someone to start an episode is good.
Getting them to stay is better.
Average consumption measures how much of an episode people actually consume.
Apple Podcasts reports Average Consumption as a percentage based on the amount of an episode users played relative to its total duration. Apple notes that the number can exceed 100% when people replay content.
This is one of the podcast analytics metrics I think creators should pay much more attention to.
An episode with 10,000 starts and poor consumption may be less valuable than an episode with 5,000 starts and an audience that listens almost to the end.
What average consumption can reveal
Low consumption may indicate:
- A long or repetitive introduction
- A weak opening
- A misleading title
- Poor pacing
- Too much filler
- An abrupt change in topic
- Technical issues
- An episode that’s simply too long for the material
High consumption may indicate:
- Strong storytelling
- A useful topic
- Good episode structure
- Effective pacing
- Strong guest chemistry
- A clear match between the title and content
Don’t treat one percentage as a universal benchmark. Compare episodes against your own historical performance.
5. Audience Retention
Average consumption gives you one summary number.
Audience retention can show you where people stay and where they leave.
This is especially useful if your podcast is published on YouTube.
YouTube’s audience retention report identifies patterns such as:
- Flat sections where viewers keep watching
- Gradual declines
- Spikes where sections are replayed or shared
- Dips where viewers skip or leave
YouTube also provides an intro metric showing how much of the audience remains after the first 30 seconds.
How to use retention data
Look for noticeable drops around:
- Your opening
- Long introductions
- Sponsor messages
- Topic changes
- Extended tangents
- Calls to action
- Outro sections
Then ask why the drop occurred.
For example, if several episodes lose a large percentage of viewers during a three-minute opening, try shortening the opening on your next few episodes.
If retention improves, you’ve learned something useful about your audience.
This is one of the most practical ways to let analytics improve your content rather than simply using analytics as a scoreboard.
6. Engaged Listeners
Apple Podcasts includes another useful metric called Engaged Listeners.
Apple currently defines an engaged listener as someone who listened to or watched at least 20 minutes or 40% of an episode.
That gives creators another way to distinguish between somebody who briefly sampled an episode and somebody who spent meaningful time with it.
Why engagement depth matters
Imagine two episodes.
Episode A
- 1,500 listeners
- 450 engaged listeners
Episode B
- 1,000 listeners
- 700 engaged listeners
Episode A reached more people.
Episode B appears to have connected more deeply with the people who started it.
Which one performed better?
That depends on your goal.
If you wanted reach, Episode A may win.
If you wanted deeper audience engagement, Episode B may be more interesting.
That’s why I don’t recommend judging podcast performance using a single KPI.
7. Followers and Subscribers
Followers are one of the strongest podcast growth metrics because following requires an intentional action.
Someone may discover one episode through search and never return.
A follower is saying, in effect:
“I want to hear from this show again.”
Apple Podcasts Analytics can show follower growth, and other major platforms provide their own audience-following or subscription metrics.
YouTube also lets creators track subscribers and distinguish between new and returning viewers.
Calculate your follower conversion rate
A simple version is:
New followers ÷ new listeners × 100
For example:
500 new listeners
50 new followers
50 ÷ 500 × 100 = 10% follower conversion
The exact number isn’t as important as the trend.
If more of your listeners are choosing to follow the show over time, something is probably improving.
8. Returning Listeners
Growth isn’t just about attracting new people.
You also need people to come back.
Returning audience metrics are particularly useful for podcasts because a strong show usually depends on repeated listening.
YouTube, for example, separates parts of its audience into new and returning behavior categories and provides a rolling monthly audience view.
Not every podcast platform provides identical returning-listener data, so use whatever equivalent your analytics platform offers.
Why returning listeners matter
Consider two hypothetical podcasts.
Podcast A
Gets 5,000 people to sample one episode every month, but few return.
Podcast B
Gets 2,000 new listeners, and a large portion continues listening every week.
Podcast A has better top-of-funnel discovery.
Podcast B may be building the healthier long-term audience.
Ideally, you want both.
9. Impressions
An impression usually means your podcast or episode appeared on someone’s screen.
It does not necessarily mean they listened.
Spotify defines impressions as the number of times podcast content was displayed on someone’s screen during a selected period.
This is an important distinction.
You can have:
- High impressions
- Low clicks
- Low plays
That may mean your podcast is being discovered but isn’t convincing enough people to start listening.
Possible problems could include:
- Weak cover art
- Unclear episode titles
- Topics that don’t sound compelling
- Poor positioning
- An unclear show description
Impressions help diagnose discovery problems
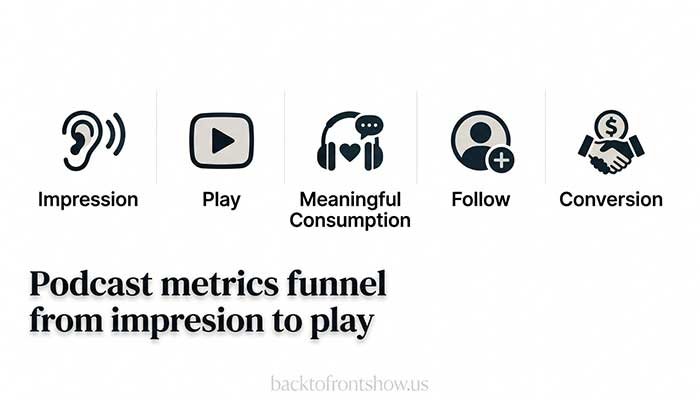
Think of your podcast funnel like this:
Impression → Interest → Play → Meaningful consumption → Follow
If impressions are low, you probably have a discovery problem.
If impressions are high but plays are low, you may have a packaging or positioning problem.
If plays are high but consumption is low, you may have a content problem.
This simple framework can make podcast metrics far easier to interpret.
10. Conversion Rate
Spotify has expanded analytics around the journey from discovery to consumption, helping creators understand how impressions and other discovery activity eventually result in meaningful engagement.
Conversion metrics can help answer questions such as:
- Are people who see the episode clicking it?
- Are people who click actually listening?
- Do social media visitors become listeners?
- Do listeners become followers?
- Do listeners join your email list?
- Do listeners purchase something?
Track the conversion that matches your goal
Your most important conversion depends on why your podcast exists.
If you’re building an audience, track:
Listener → Follower
If you’re growing an email list, track:
Listener → Email subscriber
If you’re promoting a business, track:
Listener → Lead
If you’re selling something, track:
Listener → Customer
Podcast analytics become far more valuable when they’re connected to an actual goal.
11. Traffic and Discovery Sources
You should know where your listeners come from whenever your analytics provide that information.
Possible discovery sources include:
- Platform recommendations
- Podcast search
- YouTube search
- Suggested videos
- Social media
- Direct links
- Embedded players
- Other websites
Why traffic sources matter
Suppose you’re spending five hours a week promoting episodes on three social platforms.
Analytics show:
- Platform A generates 60% of outside traffic
- Platform B generates 8%
- Platform C generates almost nothing
That doesn’t necessarily mean you should immediately abandon B and C.
But it does give you evidence to reconsider where your time goes.
One thing I’ve learned from working with content is that creators often keep repeating promotion tactics simply because they’ve become routine. Analytics can show whether those habits are actually producing results.
12. Engagement Metrics
Engagement can include different actions depending on the platform:
- Comments
- Likes
- Shares
- Poll responses
- Q&A responses
- Saves
- Direct messages
- Community interaction
Spotify, for example, includes comments in its engagement analytics and also tracks consumption time and average consumption time.
YouTube provides metrics such as likes, comments, watch time, and audience-retention information.
Don’t judge engagement only by volume
A small show can have excellent engagement.
For example:
Podcast A:
- 20,000 listeners
- 30 comments
Podcast B:
- 2,000 listeners
- 75 comments
Podcast A has the larger audience.
Podcast B has a much higher rate of visible interaction.
Again, neither number tells the whole story by itself.
13. Consumption Time and Watch Time
Total consumption time tells you how much collective attention your podcast receives.
Spotify reports consumption time and average consumption time for listening and viewing activity on Spotify.
YouTube reports watch time in hours and average view duration.
These metrics are useful because audience attention is often more meaningful than raw starts.
A 60-minute podcast with 1,000 listeners who stay for 45 minutes is producing substantially more attention than one where most people leave after three minutes.
14. Episode-to-Episode Growth
One of the best benchmarks for your podcast is your own past performance.
Instead of asking:
“Are 800 downloads good?”
Ask:
“How does 800 compare with my last 10 episodes after the same number of days?”
Spotify now provides episode benchmarks for eligible shows, comparing episode results against a normal range based on recent episode performance. Spotify says these benchmarks require at least 10 published episodes and can evaluate performance during the first 30 days after publishing.
Apple Podcasts also provides performance comparisons that let creators compare episodes over equal periods after release.
A practical tracking method
Create a simple spreadsheet with:
| Episode | 7-Day Downloads | 30-Day Downloads | Avg. Consumption | New Followers | Main Topic |
|---|---|---|---|---|---|
| Episode 21 | 620 | 940 | 63% | 22 | Marketing |
| Episode 22 | 710 | 1,020 | 71% | 35 | SEO |
| Episode 23 | 540 | 880 | 58% | 17 | Interviews |
After 10 or 20 episodes, patterns become easier to see.
You might discover that:
- Certain topics attract more new listeners
- Certain formats improve retention
- Shorter episodes perform better
- Interviews generate more followers
- Solo episodes create stronger completion rates
Those insights are much more useful than checking your dashboard every day.
15. Revenue Metrics
If your podcast earns money, revenue should eventually become part of your podcast KPIs.
Relevant metrics can include:
- Advertising revenue
- Sponsorship revenue
- Revenue per episode
- Subscriber revenue
- Affiliate revenue
- Leads generated
- Customer conversions
- Revenue attributed to the podcast
But don’t force revenue tracking onto a podcast whose current goal is audience development.
A new creator may be better served by focusing first on:
Discovery → Consumption → Retention → Loyalty
Monetization becomes easier to evaluate once you understand those fundamentals.
Which Podcast Metrics Matter Most for Beginners?
If you’re new to podcast analytics, I wouldn’t recommend building a complicated dashboard.
Start with five metrics:
- Downloads or plays
- Unique audience
- Average consumption or retention
- Follower growth
- Episode performance compared with previous episodes
These cover reach, engagement, loyalty, and growth.
Once those metrics are useful to you, add discovery sources and conversion data.
Read More: How to Measure Podcast Engagement
How Often Should You Check Podcast Analytics?
For most independent podcasters, checking analytics every few minutes isn’t useful.
A practical schedule is:
After each episode
Check:
- Initial plays or downloads
- Early retention
- Technical issues
After 7 days
Review:
- 7-day downloads
- Consumption
- Engagement
- Followers gained
- Performance versus recent episodes
After 30 days
Review:
- Finalized episode trends
- Long-tail downloads
- Discovery sources
- Follower growth
- Topic performance
Monthly or quarterly
Look at the show as a whole:
- Total audience growth
- Returning audience
- Best-performing topics
- Weakest episodes
- Engagement trends
- Promotion channels
- Revenue or conversion performance
The bigger picture matters more than daily fluctuations.
Common Podcast Analytics Mistakes
Tracking only downloads
Downloads are useful, but they don’t tell you whether people actually stayed.
Pair downloads with consumption or retention.
Comparing different time periods
Don’t compare a seven-day-old episode with a six-month-old episode using lifetime downloads.
Use equal windows.
Comparing yourself with unrelated podcasts
A celebrity interview show and a niche B2B podcast may have completely different audience sizes and business goals.
Your own historical performance is usually a better benchmark.
Treating every platform metric as identical
Apple, Spotify, YouTube, and hosting platforms can define similar-sounding metrics differently.
Check the definition before making comparisons.
Reacting to one episode
One unusually strong or weak episode doesn’t necessarily indicate a trend.
Look for repeated patterns.
Ignoring listener behavior
A high download number can feel impressive, but if most listeners leave immediately, there’s a bigger issue to solve.
A Simple Podcast KPI Framework
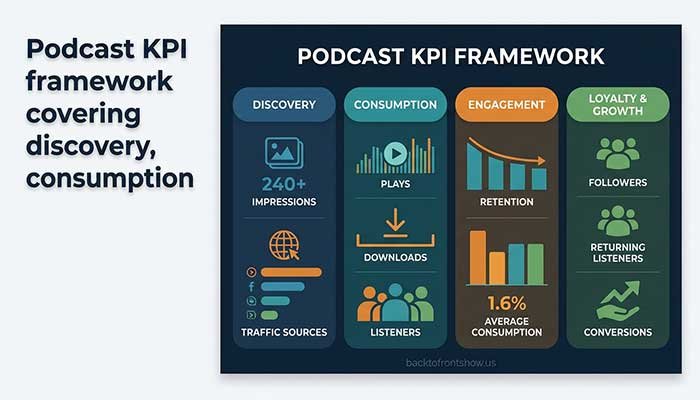
If analytics feel overwhelming, organize your metrics into four stages.
1. Discovery
Track:
- Impressions
- Traffic sources
- Search discovery
- Social referrals
Ask:
Are people finding the podcast?
2. Consumption
Track:
- Plays
- Downloads
- Unique listeners
- Watch time
- Consumption time
Ask:
Are people actually starting the content?
3. Engagement
Track:
- Retention
- Average consumption
- Engaged listeners
- Comments
- Likes
- Shares
Ask:
Do they find the content valuable enough to stay?
4. Loyalty and Growth
Track:
- Followers
- Subscribers
- Returning listeners
- Repeat consumption
- Conversions
Ask:
Are people coming back and becoming part of the audience?
That’s the framework I’d recommend before worrying about dozens of individual analytics.
Read More: What Is Podcast Analytics? A Beginner’s Guide to Podcast Data
Final Takeaway
The best podcast metrics aren’t necessarily the biggest numbers.
They’re the numbers that help you make better decisions.
Downloads can tell you about reach.
Unique listeners can help estimate audience size.
Retention and average consumption show whether people stay.
Followers and returning listeners show whether your audience is becoming loyal.
Impressions and conversion metrics help explain how effectively your podcast turns discovery into listening.
Instead of asking, “Is this number good?”, ask:
“Is this metric improving, what caused the change, and what should I do differently next?”
That’s when podcast analytics become genuinely useful.
FAQs:
Sources
- Apple Podcasts for Creators — Analytics: Definitions and information for listeners, engaged listeners, plays, average consumption, follower data, and episode performance comparisons.
Apple Podcasts Analytics documentation - Spotify for Creators — Overview Analytics: Current definitions for plays, downloads, audience, episode benchmarks, and analytics reporting.
Spotify Overview Analytics documentation - Spotify for Creators — Analytics Glossary: Current definitions for plays, downloads, audience, impressions, watch-time metrics, and sharing conversions.
Spotify Analytics Glossary - Spotify for Creators — Engagement Analytics: Information about consumption time, average consumption time, and comments.
- Spotify for Creators — Audience Conversion Metrics: Information about Spotify’s discovery-to-consumption analytics and audience journey.
- YouTube Help — Audience Retention: Official explanation of audience-retention curves, intros, dips, spikes, and top moments.
YouTube Audience Retention documentation - YouTube Help — Engagement Analytics: Official information about watch time, average view duration, and engagement reports.
- YouTube Help — YouTube Analytics: Overview of impressions, unique viewers, audience, subscribers, retention, watch time, and related analytics.
- IAB — Digital Audio Measurement Guide / Podcast Measurement Standards: Industry guidance covering podcast downloads, listeners, and measurement concepts.