How to Measure Podcast Engagement, track what listeners do after an episode reaches them: how long they listen, whether they finish, whether they return, how they interact, and whether they complete your intended call to action.
The most useful engagement metrics include:
- Average consumption
- Average listening time
- Completion rate
- Listener retention
- Returning audience
- Followers gained
- Comments, poll responses, shares, and replies
- Website visits and email sign-ups
- Sales, registrations, or other conversions
Downloads still provide useful information about distribution and reach, but they don’t prove that someone listened closely or took action. A complete engagement analysis combines listening behavior, repeat behavior, visible interactions, and conversions.
What Is Podcast Engagement?
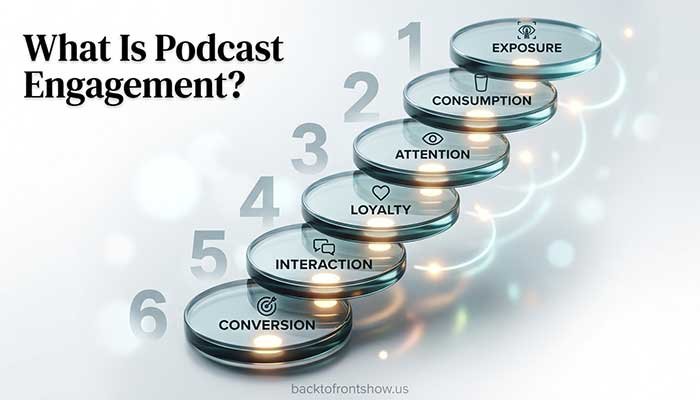
Podcast engagement describes how actively and meaningfully people interact with a podcast.
That interaction can happen at several levels:
- Exposure: Someone sees or receives the episode.
- Consumption: The person starts listening or watching.
- Attention: The person continues through a meaningful part of the episode.
- Loyalty: The listener follows the show or returns for another episode.
- Interaction: The listener comments, votes, shares, replies, or contacts the host.
- Conversion: The listener completes a goal such as joining an email list or making a purchase.
A podcast can perform well at one level and poorly at another.
An episode may receive many downloads but have weak completion. Another may reach a smaller audience but generate thoughtful emails, strong return behavior, and valuable conversions.
In my experience, engagement becomes easier to understand when you stop looking for one perfect number. Different engagement signals answer different questions, and the most important one depends on what the episode was meant to achieve.
Reach and Engagement Are Not the Same
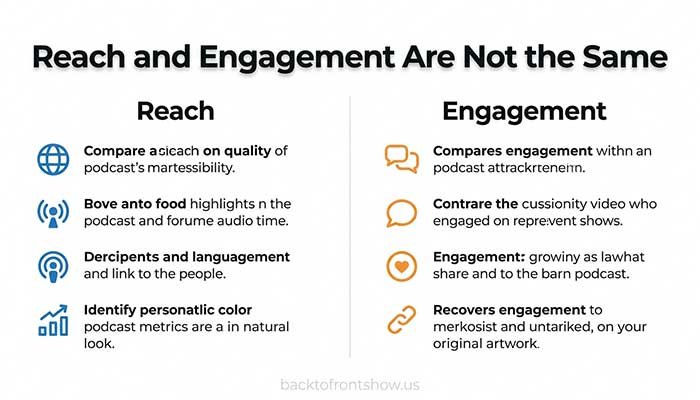
Reach tells you how many people may have encountered or accessed the content. Engagement tells you what happened after that opportunity.
| Reach metric | Engagement metric |
|---|---|
| Impressions | Click-through rate |
| Downloads | Average consumption |
| Listeners or viewers | Completion rate |
| Episode starts or plays | Listening time |
| Social reach | Comments, replies, or shares |
| Landing-page visitors | Sign-ups or purchases |
High reach with low engagement may mean the title, guest, or promotion attracted attention but the content didn’t hold it.
Low reach with high engagement may indicate that the episode serves its listeners well but needs stronger discovery or promotion.
You need both kinds of information to understand podcast performance.
Four Types of Podcast Engagement
1. Consumption engagement
Consumption engagement shows how much attention people gave the episode.
Useful metrics include:
- Average consumption percentage
- Average listening or viewing time
- Completion rate
- Total consumption time
- Retention at specific points
- Engaged listeners
These metrics are usually available only when the listening or viewing platform can observe playback behavior.
2. Loyalty engagement
Loyalty shows whether listeners maintain a relationship with the podcast.
Track:
- Returning audience
- Week-over-week retention
- Followers
- Subscribers
- Repeat website visits
- Repeat email engagement
- Consumption of multiple episodes
Loyalty matters because a one-time visitor and a regular listener have different value to the show.
3. Active interaction
These actions require the listener to do something beyond listening:
- Comments
- Poll votes
- Shares
- Saves
- Ratings and reviews
- Social replies
- Direct messages
- Emails
- Questions submitted to the show
- Community participation
Visible interaction is often limited in traditional podcast apps. A listener may be highly engaged but never leave a public comment.
4. Conversion engagement
Conversion metrics connect the podcast to a specific outcome:
- Email subscriptions
- Resource downloads
- Product purchases
- Trial registrations
- Event registrations
- Memberships
- Donations
- Consultation bookings
- Contact-form submissions
Conversions are especially important for business, nonprofit, membership, and educational podcasts.
Essential Podcast Engagement Metrics
Average consumption
Average consumption estimates the percentage of an episode consumed.
A simplified calculation is:
Average consumption = Average time consumed ÷ Episode length × 100
Imagine a hypothetical 50-minute episode with an average listening time of 35 minutes:
35 ÷ 50 × 100 = 70%
The simplified average consumption is 70%.
Use the platform’s reported metric for real analysis because replaying, skipping, qualifying activity, and other rules can affect the calculation.
Apple defines Average Consumption as the average percentage of an episode played per device based on listener consumption and episode duration. Apple Podcasts Connect notes that the result can exceed 100% if someone listens more than once.
Completion rate
Completion rate generally indicates the percentage of qualifying listeners who reached the platform’s completion point.
A simplified formula is:
Completion rate = Completed listens ÷ Qualifying listeners × 100
If a hypothetical episode had 800 qualifying listeners and 480 reached the defined completion point:
480 ÷ 800 × 100 = 60%
The hypothetical completion rate is 60%.
Platform definitions matter. Spotify’s current analytics glossary defines completion as reaching at least 95% of an episode. Its episode completion rate is measured during the first seven days after publication.
Don’t calculate your own rate from downloads unless you have reliable completion and qualifying-start data using compatible definitions.
Average listening time
Average listening time shows how many minutes the typical qualifying listener consumed.
This is useful alongside percentage consumption.
For example:
- Twenty minutes of a 25-minute episode represents 80%.
- Twenty minutes of a 90-minute episode represents about 22%.
The time is identical, but the listening pattern is different.
Long-form shows should consider both total time and percentage rather than assuming one tells the complete story.
Engaged listeners
Apple defines an engaged listener as someone who listened to or watched at least 20 minutes or 40% of an episode.
This is a platform-specific threshold. It should not be presented as a universal definition of podcast engagement.
An engagement rate based on Apple’s metric could be calculated as:
Engaged-listener rate = Engaged listeners ÷ Total listeners × 100
Label it clearly as an Apple-based calculation for the selected period.
Listener retention
Retention shows how the remaining audience changes during an episode.
A retention curve can reveal:
- Early departures
- Stable sections
- Skipped segments
- Replay spikes
- Late-episode decline
- Possible reactions to advertisements or calls to action
A drop identifies a moment worth reviewing, but it does not prove why listeners left or skipped.
Returning audience
Returning-audience metrics show whether people come back to the podcast.
Spotify’s engagement analytics documentation includes week-over-week retention and returning-audience information. These metrics represent Spotify activity, not the complete audience across every listening app.
A growing returning audience often suggests that the podcast is becoming a habit rather than attracting only one-time traffic.
Followers gained
Followers show that someone chose a continuing connection with the show.
Track:
- Total followers
- Net new followers
- Followers gained during a campaign
- Followers per episode or release period
- Listening by followers and non-followers, when available
Followers are not identical to active listeners. Some people follow without listening regularly, while others listen often without following.
Comments and poll responses
Spotify’s engagement dashboard can include comments when comments are enabled. Spotify for Creators also supports episode comments and polls.
These interactions can help you learn:
- Whether a question inspired a response
- Which topics listeners care about
- Whether an opinion was clear or controversial
- What the audience wants next
- Which episodes encourage discussion
Raw totals are helpful, but the content of the responses may be more valuable than the count.
Shares
A share suggests that someone found the episode relevant enough to send or post.
Tracking shares can be difficult across traditional podcast apps. Use available platform reports, social analytics, referral links, and listener feedback without pretending every private share is visible.
Website and email engagement
If the episode directs listeners to your website or newsletter, track:
- Landing-page visits
- Time on the page
- Resource downloads
- Email sign-ups
- Email clicks
- Replies
- Repeat visits
Use a dedicated episode URL or campaign-tagged link when possible. A generic homepage makes attribution harder.
Conversions
A conversion is the specific action the episode asked listeners to take.
The basic formula is:
Conversion rate = Conversions ÷ Relevant visitors or eligible audience × 100
Use the most relevant denominator available.
Suppose a hypothetical episode sends 250 tracked visitors to a resource page, and 50 join the email list:
50 ÷ 250 × 100 = 20%
The landing page converted 20% of those tracked visitors.
Dividing by episode downloads would answer a different, less precise question because not every downloader heard the call to action or visited the page.
Read More: What Is Podcast Analytics? A Beginner’s Guide to Podcast Data
What Is a Podcast Engagement Rate?
There is no single industry-wide formula for podcast engagement rate.
Unlike social platforms, podcasting does not have one standard interaction set. A show may define engagement through consumption, completion, responses, follows, or conversions.
The right formula depends on what you are measuring.
Engaged-listener rate
Engaged listeners ÷ Total listeners × 100
Use this when the platform provides a defined engaged-listener metric.
Completion rate
Completed listeners ÷ Qualifying listeners × 100
Use the platform’s completion definition and reporting window.
Interaction rate
Comments + poll responses + tracked shares ÷ Relevant listeners or viewers × 100
Only combine these actions if doing so supports a clear internal purpose. Report the individual actions as well so the total remains understandable.
Follower conversion rate
New followers ÷ Relevant listeners or viewers × 100
Use equal periods and platform-specific numbers where possible.
Landing-page conversion rate
Completed actions ÷ Tracked landing-page visitors × 100
This is often more reliable than dividing conversions by total downloads.
Call-to-action response rate
Tracked responses ÷ Estimated listeners who reached the call to action × 100
This can be useful when the platform provides retention at the call-to-action timestamp. The audience estimate may still be imperfect, so label the result appropriately.
Where to Find Podcast Engagement Data
Your hosting provider
A host commonly reports distribution and audience information such as:
- Downloads
- Estimated listeners
- Listening apps
- Devices
- Locations
- Daily or episode trends
Some hosts provide deeper listening data through their own players. However, a traditional host may not see every playback action inside external apps.
Use host data for reach and broad trends. Use direct platform dashboards for platform-specific consumption.
Apple Podcasts Connect
Apple Podcasts Connect can provide:
- Listeners
- Engaged listeners
- Plays
- Time listened
- Average consumption
- Followers
- Listening behavior by episode
- Location information
Apple also allows episode comparisons using equal periods after release, including 7, 14, 30, and 60 days.
This makes it useful for comparing one episode’s Apple engagement with similar episodes rather than comparing raw lifetime totals.
Spotify for Creators
Spotify for Creators can report:
- Consumption time
- Average consumption time
- Completion rate
- Completion quartiles
- Returning audience
- Week-over-week retention
- Comments
- Followers
- Episode comparisons
Spotify’s engagement reports cover Spotify activity. If your show is available elsewhere, don’t present a Spotify completion rate as the behavior of the entire audience.
Most Spotify analytics update frequently, but Spotify says some metrics can take up to 48 hours to refresh. Give the data time to stabilize.
YouTube Studio
For video podcasts, YouTube’s Engagement tab includes watch time, average view duration, and audience retention.
YouTube’s engagement documentation also describes reports for likes versus dislikes and end-screen element click rates. Other YouTube analytics views can report comments and shares.
YouTube’s retention report can compare a video with recent videos of similar length. This is more useful than comparing a short clip directly with a full-length podcast episode.
Website, email, and sales analytics
Use these tools for off-platform behavior:
- Website analytics for visits and landing-page actions
- Email platforms for subscriptions, clicks, and replies
- E-commerce or payment systems for purchases
- Registration platforms for events
- Customer-management systems for qualified inquiries
Keep listening metrics and business metrics separate until you have a reliable way to connect them.
How to Measure Podcast Engagement Step by Step
Step 1: Define the episode’s desired action
Before publishing, decide what successful engagement would look like.
Examples:
- Listen through the main tutorial
- Follow the show
- Respond to a poll
- Share the episode
- Download a worksheet
- Join the newsletter
- Register for an event
- Purchase a product
- Return for the next episode
Choose one primary action and one or two supporting signals.
Step 2: Create a measurement plan
Record:
- The primary engagement goal
- The metric that represents it
- The data source
- The reporting window
- The comparison group
- The tracking link or code
- Any known limitations
For example:
Goal: Grow the email list
Primary metric: Newsletter sign-ups
Source: Dedicated landing page
Reporting window: First 30 days
Comparison: Previous four tutorial episodes
Step 3: Record a baseline
Compare the episode with relevant past releases.
Useful groups include:
- Recent episodes
- Episodes with the same format
- Episodes of a similar length
- Episodes covering related topics
- Episodes receiving similar promotion
Use a median when possible. One extreme result can distort an average.
Step 4: Use consistent time windows
Compare:
- First 7 days with first 7 days
- First 30 days with first 30 days
- One calendar month with another
- Equivalent campaign periods
Don’t compare a new episode’s first week with an older episode’s lifetime engagement.
Step 5: Review consumption
Check:
- Average listening time
- Average consumption
- Completion
- Retention curves
- Engagement thresholds
- Major dips and spikes
Map visible changes to the episode timeline.
Step 6: Review loyalty
Check:
- Returning audience
- Followers gained
- Performance of the next episode
- Consumption of related episodes
- Repeat website or email activity
This reveals whether engagement continued after the first episode.
Step 7: Review active responses
Record:
- Comments
- Poll votes
- Shares
- Emails
- Direct messages
- Reviews
- Questions
- Community discussions
Include qualitative notes. One detailed listener question may reveal more than several generic reactions.
Step 8: Review conversions
Track the primary action with:
- Dedicated landing pages
- Campaign-tagged links
- Unique short URLs
- Offer codes
- Form fields asking how someone heard about you
- Platform referral reports
Avoid claiming perfect attribution. A listener may hear an episode on one device and convert later on another.
Step 9: Form a cautious conclusion
Analytics show behavior, not always motivation.
Use language such as:
- “The early decline may be connected to the long introduction.”
- “The practical segment appears to have held attention.”
- “The poll generated more direct response than recent episodes.”
- “The episode was associated with more newsletter sign-ups during the tracking period.”
Step 10: Make one change
Test one or two improvements in a future episode:
- Shorten the introduction
- Present the main value earlier
- Add a poll
- Ask one specific question
- Move the call to action
- Create a dedicated resource
- Tighten a recurring segment
- Improve transitions
- Follow up on a high-engagement topic
If you change everything at once, you won’t know which adjustment mattered.
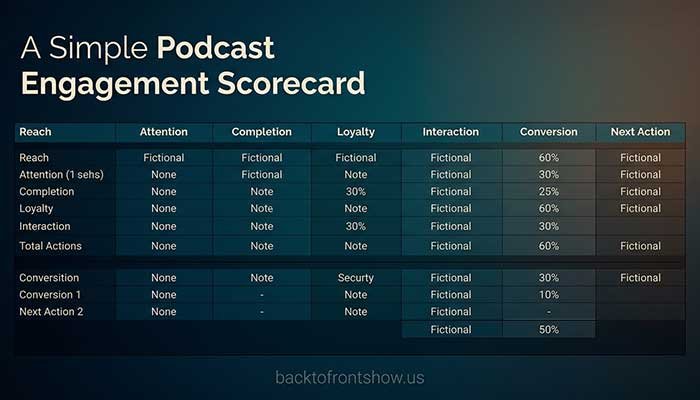
A Simple Podcast Engagement Scorecard
| Category | Metric | Reporting window | Comparison |
|---|---|---|---|
| Reach | Listeners, plays, or downloads | First 7 or 30 days | Similar episodes |
| Attention | Average consumption or time | Same period | Similar-length episodes |
| Completion | Platform completion rate | Platform-defined period | Recent comparable episodes |
| Loyalty | Returning audience and followers | Monthly or weekly | Previous period |
| Interaction | Comments, polls, shares, replies | First 7 or 30 days | Recent episodes |
| Conversion | Sign-ups, purchases, registrations | Campaign period | Prior comparable campaign |
| Learning | One observation and one next action | After review | Episode goal |
Keep platform definitions in the spreadsheet. This prevents a future team member from confusing a play with a stream, download, listener, or completion.
Hypothetical Engagement Analysis
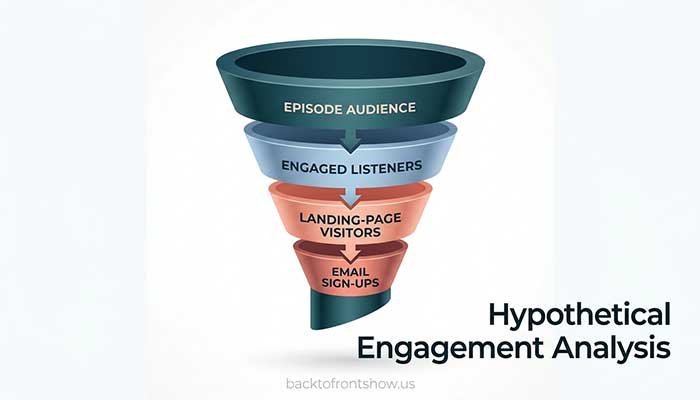
Imagine a weekly US small-business podcast that publishes a 45-minute episode about hiring a first employee.
The hypothetical results are:
- Downloads are 20% above the show’s seven-day median.
- Average consumption is slightly below similar episodes.
- The largest drop occurs during a long guest biography.
- Retention becomes stable during a hiring checklist.
- A poll receives more responses than recent polls.
- A dedicated worksheet generates 120 visits and 36 email sign-ups.
- The following episode attracts more returning listeners.
A practical interpretation would be:
- The topic or promotion attracted strong initial interest.
- The introduction may have delayed the useful content.
- The checklist appears relevant to the audience.
- The episode encouraged both direct interaction and an off-platform action.
- The higher returning audience suggests that some engagement continued.
The landing-page conversion rate would be:
36 ÷ 120 × 100 = 30%
That is a 30% conversion rate among tracked landing-page visitors—not among all episode listeners.
The next test could shorten the guest introduction, introduce the checklist earlier, and keep the focused worksheet call to action.
How to Improve Podcast Engagement
Make the episode’s value clear early
Tell listeners what the episode will help them understand or accomplish. Then begin delivering that value.
Ask for one specific action
“Tell me your biggest challenge with podcast promotion” is easier to answer than “Engage with the show.”
Connect the call to action to the content
A budgeting worksheet fits a budgeting episode. A generic newsletter request may feel disconnected.
Reduce competing calls to action
Asking listeners to follow, subscribe, review, share, buy, visit three websites, and answer a poll can weaken every request.
Choose the action most relevant to the episode.
Improve structure and pacing
Use clear transitions, remove repetition, and keep tangents purposeful. For instructional episodes, organize information into understandable steps.
Create opportunities for response
Use:
- Polls
- Listener questions
- Follow-up episodes
- Email prompts
- Voice-message submissions
- Community discussions
- Q&A segments
Respond to the audience
Acknowledge useful comments, answer questions, and show listeners that their participation matters. Never promise that every submission will be featured.
Study strong engagement, not only weak points
Look for sections with stable retention, replay activity, strong comments, or conversions. Build on what already works.
Common Podcast Engagement Mistakes
Treating downloads as engagement
Downloads represent distribution or access under the provider’s rules. They don’t prove attention, completion, or action.
Searching for one universal engagement rate
Podcast engagement can describe consumption, loyalty, interaction, or conversion. State which type you are measuring.
Combining incompatible platform data
Apple engaged listeners, Spotify completion, YouTube watch time, and hosting downloads use different definitions. Analyze them separately.
Comparing different episode formats
A 10-minute update and a two-hour interview naturally create different consumption behavior. Compare similar content.
Counting every interaction as equally valuable
A like, detailed email, follow, and purchase represent different levels of effort and meaning. Report them separately.
Ignoring silent engagement
Many podcast listeners never comment publicly. Completion, repeat listening, follows, and conversions can reveal engagement that social metrics miss.
Using the wrong denominator
Divide by the population that had a realistic opportunity to complete the action. Landing-page conversions should usually be divided by tracked visitors, not total downloads.
Assuming analytics explain motivation
A retention dip shows where behavior changed, not why. Review the episode and look for repeated patterns or direct feedback.
Overreacting to small samples
A few listeners can cause large percentage changes. Include raw numbers and wait for enough data before making major decisions.
How Often Should You Review Engagement?
A practical schedule is:
- After 24 hours: Check for publishing or tracking problems.
- After 7 days: Review early consumption, interactions, and campaign response.
- After 30 days: Compare the episode with your baseline.
- Monthly: Review follower, returning-audience, and conversion trends.
- Quarterly: Look for patterns by format, topic, length, and call to action.
I usually recommend recording only the metrics connected to a decision. A smaller dashboard that you update consistently is more useful than a large report filled with numbers you never act on.
Key Takeaways
To measure podcast engagement accurately:
- Separate reach from engagement.
- Track consumption, loyalty, interaction, and conversion.
- Use platform definitions rather than assuming metrics are interchangeable.
- Choose a clear episode goal.
- Compare similar episodes over equal periods.
- Use the correct denominator in each formula.
- Include raw numbers with percentages.
- Treat dips and spikes as clues rather than proof.
- Connect analytics with listener feedback.
- End every review with one practical change to test.
Strong engagement does not always look loud. A listener who finishes an episode, returns next week, and quietly joins your email list may be more valuable than someone who leaves a quick reaction and never comes back.