How To analyze podcast episode performance, compare each episode’s reach, listening behavior, audience response, and conversions against similar episodes over the same period after publication.
In practical terms, that means checking:
- Downloads or listeners
- Performance during the first 7, 30, and 60 days
- Listener retention and completion
- Engagement such as comments, shares, and poll responses
- Traffic sources
- Follows, email sign-ups, sales, or other conversions
- Results compared with your typical episode
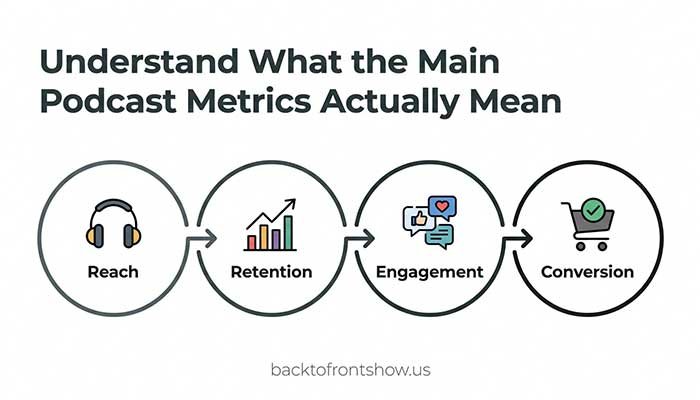
No single metric tells you whether an episode succeeded. Downloads show distribution or reach, while retention helps reveal whether people stayed. Engagement shows whether the subject generated a response, and conversions tell you whether listeners took the action you wanted.
The goal of episode analysis isn’t to collect an impressive-looking set of numbers. It’s to find patterns that help you make better editorial, production, and marketing decisions.
Start by Defining What Success Means
Before opening an analytics dashboard, decide what the episode was supposed to accomplish.
An episode designed to attract new listeners should be judged differently from one created to sell a product, strengthen loyalty, or answer a detailed question for existing subscribers.
Common episode goals include:
- Reaching new listeners
- Increasing consumption time
- Getting more people to follow the show
- Driving visits to a website
- Generating email sign-ups
- Promoting a product, service, or event
- Encouraging comments, shares, or poll responses
- Keeping existing listeners engaged between major episodes
Choose one primary goal and, at most, two supporting goals. This gives your analysis a clear focus.
For example, if you publish an interview with a recognizable guest, discovery and new listeners may be the primary goals. If you publish a tutorial connected to a paid course, clicks and sales may matter more than total downloads.
In my experience, creators often become disappointed with an episode because they evaluate it using a metric that wasn’t connected to its original purpose. A smaller, highly relevant audience can produce a much better business result than a larger but less interested audience.
Understand What the Main Podcast Metrics Actually Mean
Podcast platforms don’t always use the same definitions. A “play,” “download,” “listener,” and “view” may represent different behaviors depending on the platform.
That’s why you should avoid combining unrelated numbers as if they measured the same thing.
| Metric | What it generally tells you | Important limitation |
|---|---|---|
| Downloads | How often an episode file was delivered under your host’s measurement rules | A download doesn’t prove that the entire episode was heard |
| Listeners | An estimate or count of people or devices that accessed an episode | Definitions and identification methods vary |
| Plays or starts | How often playback began or active consumption was detected | A play may be counted differently across platforms |
| Average consumption | The average percentage of an episode consumed | Replays can affect the result |
| Completion rate | The percentage of qualifying listeners or viewers who reached the end | The exact calculation and time window vary |
| Retention curve | Where people continued, skipped, replayed, or stopped | Usually represents only one platform’s audience |
| Engagement | Comments, polls, likes, shares, saves, or other interactions | Not every platform provides the same interactions |
| Conversions | Actions such as sign-ups, purchases, or bookings | Requires reliable tracking outside the listening app |
The IAB Tech Lab’s Podcast Measurement Technical Guidelines exist to make podcast measurement more consistent, particularly for downloads, audiences, and advertising. The current standard is version 2.3, released in September 2026.
If your hosting company is IAB Tech Lab–certified, that can make its download reporting more useful for advertising and comparison. However, even standardized downloads should not be treated as proof that every person listened to the entire episode.
Use the Right Analytics Sources
A complete episode analysis usually requires information from more than one dashboard.
Your podcast hosting provider
Your host is normally the best starting point for cross-platform distribution data. Depending on the provider, it may report:
- Downloads
- Estimated unique listeners
- Listening apps
- Devices
- Geographic locations
- Download trends
- Referral or source information
Use the host’s data for your broad view of episode reach. Check its documentation so you understand exactly how it defines each metric.
Apple Podcasts Connect
Apple Podcasts Connect provides listening information specifically for activity on Apple Podcasts.
According to Apple’s analytics documentation, its available episode metrics include listeners, engaged listeners, plays, time listened, and average consumption. Apple defines an engaged listener as someone who listened to or watched at least 20 minutes or 40% of an episode.
Apple also lets creators compare episode performance over matching periods such as 7, 14, 30, or 60 days after release. That is much more useful than comparing the lifetime results of an old episode with the first week of a new one.
Apple may withhold analytics when there isn’t enough activity. Its current minimum threshold is at least five unique users for the selected show, metric, and period.
Spotify for Creators
Spotify for Creators can help you examine Spotify-specific consumption and engagement.
Its engagement analytics documentation describes metrics such as consumption time, average consumption time, comments, episode completion, returning audience, and week-over-week retention. Spotify’s completion comparison uses the first seven days after publication for recent episodes.
This makes it useful for questions such as:
- Did listeners finish this episode?
- Did a longer format hold attention?
- Are people returning from one week to the next?
- Which recent episodes performed above or below the show’s average?
Remember that Spotify data represents Spotify activity. It shouldn’t be presented as the behavior of your entire audience unless nearly all your listening happens there.
YouTube Studio
If you publish video podcasts—or distribute an audio podcast to YouTube—YouTube Studio adds another set of useful signals.
YouTube’s podcast documentation lists impressions, click-through rate, views, traffic sources, and watch time among its available podcast analytics. Its audience-retention report can also show how well individual moments held viewers’ attention.
YouTube metrics are especially helpful for separating two different problems:
- Low impressions may mean the episode wasn’t widely shown.
- Strong impressions but a low click-through rate may point to the title or thumbnail.
- A healthy click-through rate followed by an early retention drop may point to the opening or a mismatch between the promise and the content.
How to Analyze Podcast Episode Performance Step by Step
Step 1: Record the episode’s goal and basic details
Create a simple record for every episode containing:
- Episode title
- Publication date
- Topic
- Format
- Guest, if applicable
- Episode length
- Primary goal
- Main call to action
- Promotional channels used
- Any unusual circumstances
This context prevents misleading comparisons later.
An interview promoted by a well-known guest shouldn’t automatically be compared with an unpromoted solo episode. A holiday release may behave differently from an episode published during a normal workweek.
Step 2: Choose consistent measurement windows
Record performance after the same number of days for every episode.
Useful checkpoints include:
- First 24 hours for an early directional signal
- First 7 days for initial performance
- First 30 days for a more stable comparison
- First 60 or 90 days for long-tail performance
The best window depends on your publishing schedule and audience behavior. A daily news podcast may learn most of what it needs within a few days. An evergreen educational show may continue attracting listeners for months.
Avoid comparing the lifetime downloads of a six-month-old episode with the seven-day total of an episode published last week.
Step 3: Build a baseline from comparable episodes
A raw number has little meaning without context. Compare the episode with a relevant group, such as:
- Your last 10 episodes
- Episodes released in the same season
- Episodes using the same format
- Episodes of a similar length
- Previous episodes covering the same subject
- Episodes receiving a similar promotional effort
The median is often a useful baseline because one unusually popular or unpopular episode won’t distort it as much as the average.
To calculate the median, arrange the results from lowest to highest and find the middle value. If you have an even number of episodes, average the two middle values.
You can then calculate the episode’s difference from the baseline:
Performance difference (%) = (Episode result − Baseline result) ÷ Baseline result × 100
Imagine a hypothetical weekly business podcast with a seven-day median of 1,000 downloads. A new episode receives 1,250 downloads during its first seven days:
(1,250 − 1,000) ÷ 1,000 × 100 = 25%
The episode performed 25% above that show’s seven-day median for downloads.
That does not mean it was 25% better in every respect. You still need to check retention, engagement, and conversions.
Read More: Podcast Analytics for Beginners: How to Understand Your Podcast Data
Step 4: Evaluate reach
Start with downloads, listeners, plays, or views—whichever reach metrics are appropriate for the platform.
Ask:
- Did the episode perform above or below the usual range?
- Was growth immediate, or did it happen gradually?
- Did one platform contribute an unusually large share?
- Did a guest, newsletter, search result, or social post create a visible spike?
- Did the episode continue attracting listeners after the launch period?
Look at the trend, not just the final total. Two episodes can reach the same number while following very different paths.
One may receive most of its attention on release day and then disappear. Another may start slowly but continue growing through search, recommendations, or shares. The second pattern may indicate stronger long-term value.
Step 5: Examine listener retention
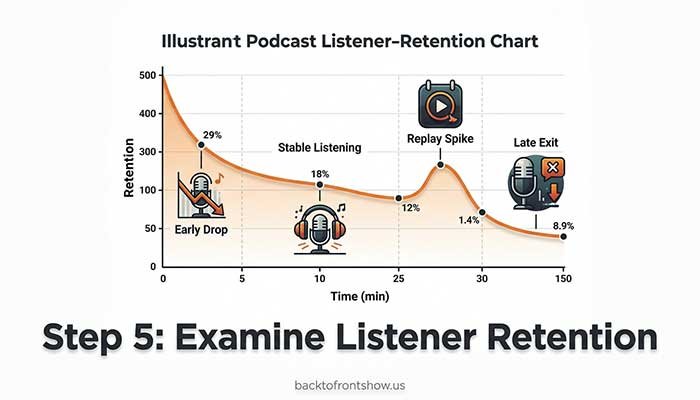
Retention shows how well the content held attention after someone started listening or watching.
Review:
- Average consumption percentage
- Average listening or viewing duration
- Completion rate
- The retention curve
- Sudden drops
- Replayed or unusually stable sections
- Skipped segments, when the platform provides that detail
When reviewing a retention graph, focus on meaningful changes rather than every small movement.
A sharp drop near the beginning
Possible causes include:
- An introduction that takes too long
- Too many announcements before the main topic
- An opening that doesn’t match the title
- Audio or video quality problems
- A guest introduction that includes unnecessary detail
A drop during a specific segment
Possible causes include:
- An abrupt topic change
- A long promotional message
- Repetition
- A confusing explanation
- A section that is less relevant than the episode’s main promise
A spike or replayed section
This may indicate:
- A useful quote
- A complicated point listeners replayed
- A memorable story
- A practical instruction
- A chapter or timestamp people visited directly
Treat these as hypotheses, not proven explanations. Analytics show what happened, but they don’t always explain why. Confirm your interpretation by reviewing the content and, when possible, asking listeners.
Step 6: Review engagement signals
Engagement metrics help show whether an episode created enough interest for someone to respond.
Depending on your format and platforms, examine:
- Comments
- Poll votes
- Likes
- Shares
- Saves
- Direct messages
- Email replies
- Reviews mentioning the episode
- Questions submitted after publication
- Visits to linked resources
The most valuable engagement is connected to your goal.
A detailed email from a listener may be more useful than dozens of passive likes. A poll response can reveal what the audience wants next. A share can introduce the show to a new listener.
Because many podcast apps don’t offer public social features, low visible engagement doesn’t necessarily mean listeners were uninterested. Use calls to action that give people a clear and trackable way to respond.
Step 7: Measure conversions
If the episode asked listeners to take action, track that action separately.
Possible conversions include:
- Newsletter subscriptions
- Resource downloads
- Website visits
- Contact-form submissions
- Product purchases
- Trial registrations
- Event registrations
- Membership sign-ups
- Consultation bookings
Use a dedicated landing page, a memorable URL, a campaign-tagged link, a unique offer code, or a clearly labeled form field when appropriate.
A basic conversion-rate formula is:
Conversion rate = Conversions ÷ Relevant visitors or listeners × 100
Use the most relevant denominator you can measure. If you know the number of landing-page visitors, use that rather than total episode downloads. Not everyone who downloaded the episode heard the call to action.
Suppose a hypothetical episode generated 300 visits to a resource page and 45 newsletter sign-ups:
45 ÷ 300 × 100 = 15%
The landing page converted 15% of those tracked visitors. That calculation is more precise than dividing sign-ups by all episode downloads.
Step 8: Identify the likely cause of the result
Combine the metrics instead of making decisions from one number.
| Pattern | Possible interpretation | Practical next step |
|---|---|---|
| High reach, strong retention | Topic and execution both connected | Produce a follow-up or expand the topic |
| High reach, weak retention | Promotion worked, but the content or opening may not have met expectations | Review the title-to-content match and early drop-off |
| Low reach, strong retention | The people who found it valued it, but discovery was weak | Test a clearer title, thumbnail, description, or promotion plan |
| Low reach, weak retention | The topic, packaging, or execution may need reconsideration | Avoid repeating the format without a specific improvement |
| Average reach, high conversions | A smaller but highly relevant audience took action | Consider more episodes for this audience segment |
| Strong early results, weak long tail | Launch promotion worked, but the episode lacks ongoing discovery | Improve evergreen positioning and repromotion |
| Slow start, steady growth | Search, recommendations, or sharing may be helping | Update and resurface the episode when relevant |
One thing I’ve noticed is that the best editorial decisions usually come from repeated patterns, not a single episode. One weak result could be caused by timing, distribution, competition, or normal variation. If the same pattern appears across several comparable episodes, it becomes much more useful.
Step 9: Write down one decision for the next episode
Analysis should end with an action.
Examples include:
- Shorten the introduction
- State the episode’s promise within the first minute
- Create a follow-up on a high-retention topic
- Move the call to action earlier
- Remove a segment that repeatedly loses listeners
- Test a shorter or more specific title
- Ask guests to share prepared promotional assets
- Add chapters to longer episodes
- Turn a frequently replayed explanation into a separate episode
- Use a dedicated landing page for better conversion tracking
Choose one or two changes at a time. If you change the title style, episode length, structure, promotion, and call to action simultaneously, it will be difficult to know what caused the next result.
Read More: 7 Best Podcast Analytics Tools in 2026 (Free & Paid)
A Simple Podcast Episode Scorecard
A spreadsheet can make episode analysis more consistent.
| Category | Metric to record | Comparison |
|---|---|---|
| Context | Topic, format, length, guest, release date | Similar episodes |
| Reach | 7-day and 30-day downloads, listeners, plays, or views | Median of comparable episodes |
| Retention | Average consumption, completion, major drop points | Recent episodes of similar length |
| Engagement | Comments, shares, replies, polls, saves | Typical engagement per episode |
| Conversion | Visits, sign-ups, purchases, or another goal | Conversion target or prior campaign |
| Discovery | Traffic sources, impressions, click-through rate | Previous episodes with similar promotion |
| Outcome | One lesson and one next action | Editorial goal |
Add short notes rather than trying to turn every observation into a score. A single overall score can hide important differences between reach, retention, and business impact.
Common Podcast Episode Analysis Mistakes
Treating downloads as completed listens
A download indicates delivery under the reporting provider’s rules. It doesn’t automatically prove that someone heard the entire episode.
Use retention or consumption metrics from listening platforms when you need evidence of listening behavior.
Comparing different time windows
An episode with 5,000 lifetime downloads hasn’t necessarily outperformed one with 1,500 downloads after seven days. Compare matching periods after release.
Combining platform metrics without checking definitions
Apple listeners, Spotify plays, hosting-provider downloads, and YouTube views are not interchangeable. Use each metric for the question it can answer.
Comparing unrelated episode types
A short solo update and a two-hour celebrity interview have different audience expectations. Build separate baselines when your formats vary significantly.
Assuming a retention drop explains itself
A drop during an advertisement may suggest that people skipped the ad, but it could also reflect an unrelated change in the discussion. Review the episode and look for recurring patterns before making a conclusion.
Overreacting to one episode
One episode is a data point, not a complete strategy. Make major changes when the evidence repeats or when listener feedback supports the same conclusion.
Ignoring the episode’s goal
An episode can produce average downloads but excellent sales, qualified inquiries, or email subscriptions. If conversion was the objective, those results matter more.
How Often Should You Review Episode Analytics?
Use a lightweight review schedule:
- After 24 hours: Check distribution problems and obvious early signals.
- After 7 days: Review initial reach, completion, and promotional performance.
- After 30 days: Compare the episode with your normal baseline.
- Quarterly: Look for patterns across topics, formats, guests, lengths, and calls to action.
Avoid checking the dashboard every few hours. Small changes rarely justify immediate editorial decisions.
I usually recommend recording the same small set of metrics after each standard period. Consistency makes the data more useful and keeps analytics from becoming a distraction from producing the show.
Key Takeaways
Effective episode analysis combines four questions:
- How many people did the episode reach?
- How much of it did they consume?
- How did they respond?
- Did they take the intended action?
Compare similar episodes over equal periods, use platform-specific metrics according to their actual definitions, and avoid treating downloads as completed listens.
Most importantly, turn each review into a practical decision. A useful analysis doesn’t end with “this episode did well.” It explains what appears to have worked, what remains uncertain, and what you’ll test next.