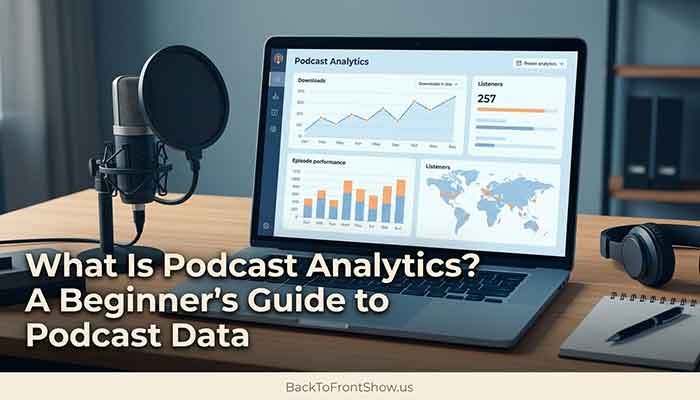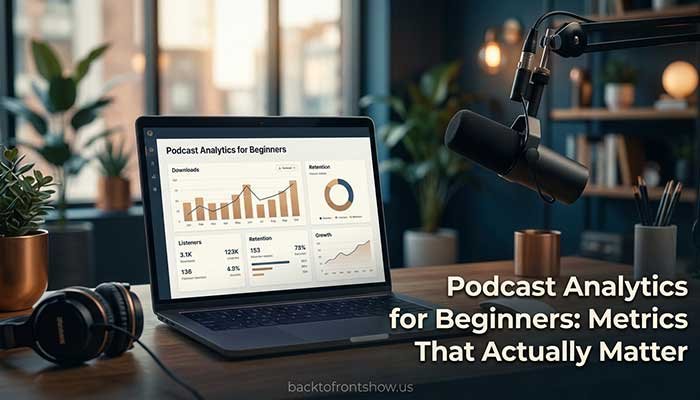
Podcast analytics tell you how people are finding, starting, and engaging with your podcast.
For a beginner, you don’t need to track dozens of numbers. Start with a few useful metrics: downloads or plays, audience size, episode performance, listening or consumption behavior, followers, and discovery data.
The important part isn’t collecting more statistics. It’s learning what each number actually means and using it to make better decisions about your podcast.
That’s especially important because podcast platforms don’t all measure activity in exactly the same way. A “download,” “play,” “listener,” and “follower” can represent different things depending on where you’re looking.
This podcast analytics guide explains the basics, which metrics deserve your attention, what they can and can’t tell you, and how to turn your numbers into practical improvements.
What Are Podcast Analytics?
Podcast analytics are measurements showing how your podcast and individual episodes are performing.
Depending on your hosting provider and listening platforms, your dashboard may show information such as:
- Downloads
- Plays or streams
- Estimated or unique audience
- Followers
- Listening time
- Episode completion
- Audience retention
- Geographic location
- Listening platforms and devices
- Discovery impressions
- Conversion rates
- Episode trends
The exact terminology varies between platforms.
For example, Apple Podcasts Connect provides metrics including listeners, engaged listeners, plays, followers, time listened, and geographic information. Apple defines an engaged listener as someone who listened to or watched at least 20 minutes or 40% of an episode.
Spotify for Creators uses its own definitions. For example, Spotify currently defines a Spotify play as an episode being watched or listened to for at least 30 seconds. If your podcast is hosted with Spotify for Creators, its Overview analytics can also include RSS download data from other podcast platforms.
That’s why the first rule of podcast data basics is simple:
Always understand how the platform defines a metric before comparing it with another number.
Podcast Analytics vs. Podcast Downloads
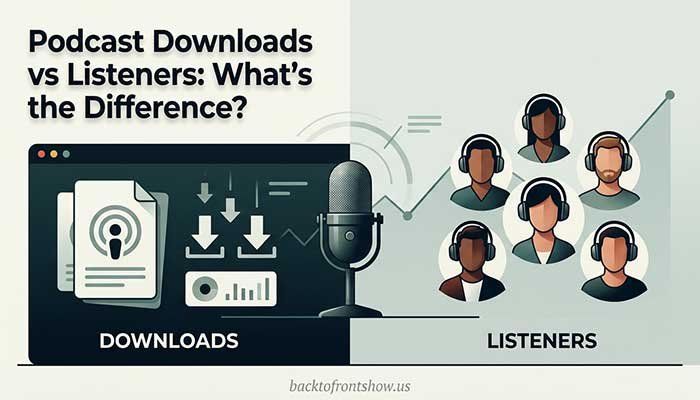
One of the biggest beginner mistakes is treating downloads and actual listening as exactly the same thing.
They aren’t.
Traditional podcast measurement relies heavily on requests for podcast files. That means a hosting platform can usually measure that an episode file was requested or delivered, but it may not always know exactly how much of that episode the person eventually listened to.
This is one reason podcast measurement works differently from many websites or social media platforms.
The IAB Tech Lab maintains industry guidelines designed to create more consistent measurement of podcast downloads, audiences, and advertising delivery. The current Podcast Measurement Technical Guidelines are Version 2.3, finalized in September 2026. The guidelines reflect the reality that open-RSS podcast measurement commonly relies on server-side file-delivery data.
So when your hosting dashboard says an episode received 1,000 downloads, don’t automatically interpret that as:
“Exactly 1,000 individual people listened to the entire episode.”
That’s much more than the download number can prove.
Instead, think of downloads primarily as a distribution and reach measurement.
Platform-level analytics from services such as Apple Podcasts and Spotify can then give you additional information about listening behavior on those specific platforms.
Read More: Podcast Downloads vs Listeners: What’s the Difference?
The Most Important Podcast Metrics for Beginners
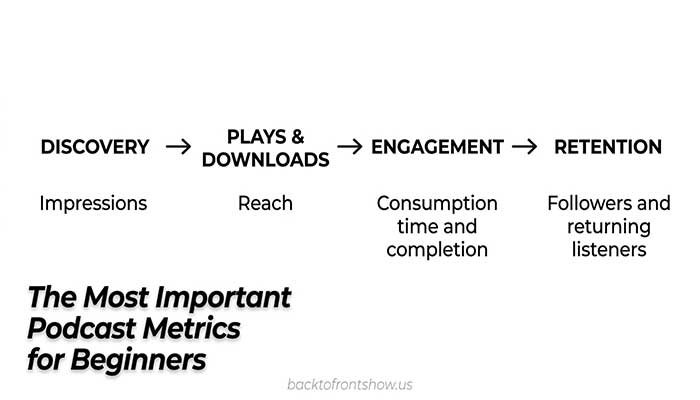
If you’re new to analytics, I’d focus on a small group of measurements first.
| Metric | What It Helps You Understand | What to Watch |
|---|---|---|
| Downloads / plays | Overall episode reach and consumption activity | Trends between similar episodes |
| Audience / listeners | Approximate size of the people consuming your show | Growth over time |
| Followers | People choosing to keep up with your show on a platform | Whether casual listeners become regular listeners |
| Consumption / listening time | How much time people spend with your content | Episodes that hold attention longer |
| Completion / retention | How far listeners make it through an episode | Major drop-off points and strong sections |
| Discovery impressions | How often your show is shown to potential listeners | Whether your visibility is growing |
| Conversion rate | How often exposure turns into plays | Titles, topics, artwork, and positioning |
| Geography | Where your audience is located | Regional opportunities and audience fit |
You don’t need every metric to improve your show.
In my experience, beginners often get more useful insight from consistently reviewing five meaningful measurements than from checking a large dashboard without knowing what they’re trying to learn.
Let’s look at the major podcast metrics individually.
1. Downloads
Downloads remain one of the most widely used podcast statistics.
At the simplest level, the number tells you how often podcast episode files were delivered according to your analytics provider’s measurement rules.
Industry measurement isn’t simply a raw count of every server request. The IAB Tech Lab’s podcast measurement framework includes methods intended to filter activity such as invalid requests and automated traffic so providers can produce more consistent measurements.
What downloads are useful for
Downloads are useful when comparing:
- New episodes against previous episodes
- Performance after 7, 30, or another consistent number of days
- Different episode topics
- Seasonal changes
- Long-term audience growth
- Results before and after a promotion
The key word is consistent.
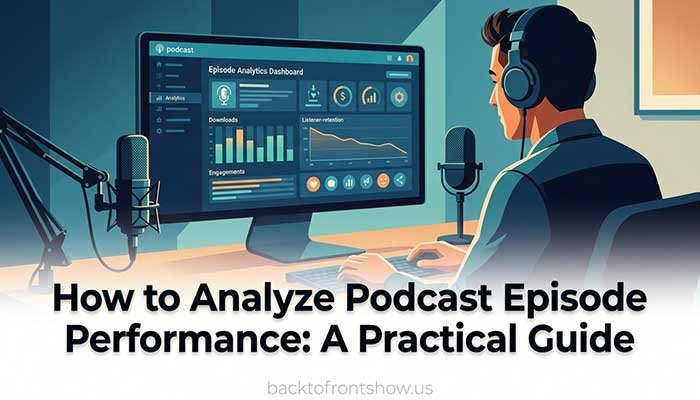
Suppose Episode A has been available for 90 days and Episode B was published four days ago. Comparing their lifetime downloads isn’t very helpful.
A better comparison would be:
- Episode A downloads after 7 days
- Episode B downloads after 7 days
Now you’re comparing the episodes at approximately the same stage of their life cycle.
What downloads don’t tell you
Downloads alone usually can’t tell you:
- Whether someone finished the episode
- Whether they enjoyed it
- Exactly how many individual humans listened
- Why someone stopped listening
- Whether someone bought something because of the episode
Use downloads as one part of your podcast reporting, not as the complete picture.
2. Plays
“Play” sounds straightforward, but its definition depends on the platform.
For example, Spotify currently counts a play after someone has listened to or watched an episode for at least 30 seconds on Spotify.
Apple Podcasts separately reports Plays in Apple Podcasts Connect as part of its listener analytics.
This is another reason I wouldn’t compare a play reported by one platform directly with a differently defined metric from another dashboard without checking the definitions first.
Instead, use platform-specific play data primarily to understand trends within that platform.
3. Audience or Listeners
Audience measurements try to answer a more useful question than raw activity:
How many different people are consuming my podcast?
The challenge is that a podcast analytics provider may not literally know the identity of every human behind every request.
Metrics can therefore depend on the provider’s methodology and available data.
Spotify, for example, describes its Audience metric as the number of unique people who played or downloaded an episode during the selected period, with availability depending partly on how the show is hosted. Spotify also notes that audience should normally be lower than combined plays and downloads because the same person may consume several episodes or play one episode multiple times.
For beginners, the most useful approach is to watch your audience trend over time instead of becoming obsessed with one isolated number.
Ask:
- Is the audience gradually growing?
- Do new releases bring people back?
- Did a particular episode attract unusually high interest?
- Does growth disappear immediately after a promotional campaign ends?
Those questions lead to decisions.
Read More: Podcast Metrics Every Creator Should Track
4. Followers
Followers can be more valuable than many beginners realize.
A person who follows your podcast has taken an extra action that can make it easier to continue receiving or discovering new episodes within that platform.
Apple Podcasts Connect allows creators to view follower data and track net-new followers across different periods. Apple also lets creators compare listening from followers with listening from people who aren’t following the show.
Follower growth can help answer:
Are people interested enough after discovering my podcast to stay connected to it?
If an episode generates many plays but almost no new followers, that isn’t automatically bad. But it’s worth investigating.
You might test:
- A clearer follow call-to-action
- A stronger show description
- More consistent episode topics
- A clearer promise about what future episodes will deliver
5. Consumption Time
Consumption time tells you how much time people actually spend listening to or watching your podcast on platforms that provide this information.
Spotify’s Engagement analytics, for example, currently includes:
- Consumption time
- Average consumption time
- Comments and other engagement information
Spotify defines consumption time as the total amount of time people spent listening to or watching your episodes on Spotify during the selected period.
This can add useful context to downloads and plays.
Imagine two hypothetical 45-minute episodes.
Episode A
- 1,500 plays
- Average consumption time: 12 minutes
Episode B
- 1,200 plays
- Average consumption time: 31 minutes
Episode A reached more people, but Episode B appears to be holding attention much longer.
That doesn’t automatically make Episode B “better.” Its subject, audience, format, and goals may be different.
But the engagement difference gives you something worth investigating.
6. Completion Rate
Completion metrics help you understand how much of an episode your audience consumes.
Definitions again matter.
Spotify currently defines episode completion as reaching at least 95% of the way through an episode. Its analytics can also show completion quartiles representing the portion of an audience that made it 25%, 50%, and 75% through an episode.
A strong completion rate can suggest that people who start the episode find enough value to continue.
A lower rate isn’t automatically a problem.
Episode length makes a difference.
Completing 80% of a two-hour interview involves far more listening time than completing 80% of a ten-minute episode.
That’s why I recommend comparing similar formats rather than expecting every episode to produce the same result.
7. Audience Retention
Retention shows whether listeners continue consuming your content rather than disappearing after discovering it.
Depending on the platform, “retention” can mean slightly different things.
Spotify, for example, includes a retention metric describing the percentage of an audience that returns each week for another episode.
Retention is especially valuable for recurring shows.
A podcast doesn’t grow sustainably simply because one episode receives a temporary spike in attention.
You usually want some of the people who discover that episode to return.
Questions retention data can help you answer
- Are new listeners becoming regular listeners?
- Are existing listeners returning for new releases?
- Did a viral episode create lasting growth or only a temporary spike?
- Does a particular topic attract an audience that returns?
For me, this is one of the more useful ways to think about podcast growth: reach gets people in; retention tells you whether they’re finding enough value to come back.
8. Discovery Impressions
Podcast analytics increasingly include information about what happens before someone presses play.
Spotify Discovery analytics, for example, reports impressions showing how often podcast content appears to users on eligible Spotify discovery surfaces. Its audience journey can also include plays and conversion rate.
That creates a useful distinction between two problems:
Visibility problem: Not enough people are seeing your podcast.
Conversion problem: People are seeing it, but not enough are choosing to play it.
Those problems require different solutions.
If impressions are low, you may need better distribution, promotion, or discoverability.
If impressions are high but plays are weak, I’d examine factors such as:
- Episode titles
- Podcast artwork
- Topic relevance
- Show positioning
- Episode descriptions
- Whether the promise is clear
Don’t immediately change your actual content when the problem may be happening before anyone listens.
9. Conversion Rate
Conversion rate generally describes the percentage of people who take a desired action after another measurable event.
In Spotify’s Discovery analytics, for example, conversion rate can represent the percentage of impressions that led to plays.
Here’s a hypothetical example:
Your podcast receives:
- 10,000 impressions
- 500 resulting plays
That would produce an impression-to-play conversion rate of:
500 ÷ 10,000 × 100 = 5%
The important part isn’t whether 5% is universally “good.”
There isn’t one conversion rate that every podcast should chase.
Instead, establish your own baseline and look for meaningful changes.
If similar episodes usually convert at 5% and a new episode converts at 8%, investigate what was different.
Maybe:
- The topic had stronger appeal
- The title was clearer
- Your guest was recognizable
- The episode matched what your audience already wanted
- The artwork or promotional message worked better
Analytics helps you form better questions. It doesn’t always give you the answer automatically.
10. Geographic Data
Many podcast dashboards can show where listening activity is coming from.
Apple Podcasts Connect, for example, includes top countries or regions and cities in its analytics.
Geographic data can help with:
- Understanding where your audience is concentrated
- Choosing examples relevant to your listeners
- Planning local events
- Evaluating regional advertising
- Selecting guests
- Adjusting promotions
- Understanding whether you’re reaching your intended market
For a podcast aimed primarily at US listeners, you might monitor whether your audience actually reflects that goal.
But don’t make major editorial changes because one city or state moves up your dashboard for a few days. Look for patterns over a meaningful period.
Where Do You Find Podcast Analytics?
You’ll normally have more than one analytics source.
Your podcast hosting provider
Your hosting company’s analytics are usually one of the most useful places for distribution-level data because your RSS-delivered audio files typically pass through your host’s infrastructure.
Depending on your host, you’ll commonly find metrics such as:
- Downloads
- Episode performance
- Audience estimates
- Listening apps
- Devices
- Geographic information
- Download trends
Available metrics and measurement methodologies vary by provider.
Apple Podcasts Connect
Apple Podcasts Connect provides listening analytics specifically for activity Apple can measure on Apple Podcasts.
Its current analytics include metrics such as:
- Followers
- Listeners
- Engaged listeners
- Plays
- Time listened
- Geographic data
- Episode-level performance
Apple states that its analytics focus on aggregated listening or viewing behavior from unique devices, while downloads and other server-side measurements may come from your hosting provider.
Apple also applies privacy and data thresholds. For example, Apple currently requires at least five unique users to play content during the selected time frame before certain analytics can appear, and some diagnostic or usage information can be delayed by up to 72 hours.
So a brand-new show may occasionally see “Not Enough Data” rather than detailed analytics.
That doesn’t necessarily mean something is broken.
Spotify for Creators
Spotify for Creators provides several types of analytics, including Overview, Engagement, and Discovery data.
Depending on your show and hosting setup, available measurements can include:
- Plays
- Downloads
- Audience
- Consumption time
- Completion data
- Retention
- Impressions
- Conversion rates
- Comments
- Discovery sources
Spotify also lets creators export several analytics sections as CSV files for further podcast reporting.
Why Numbers From Different Podcast Platforms Don’t Always Match
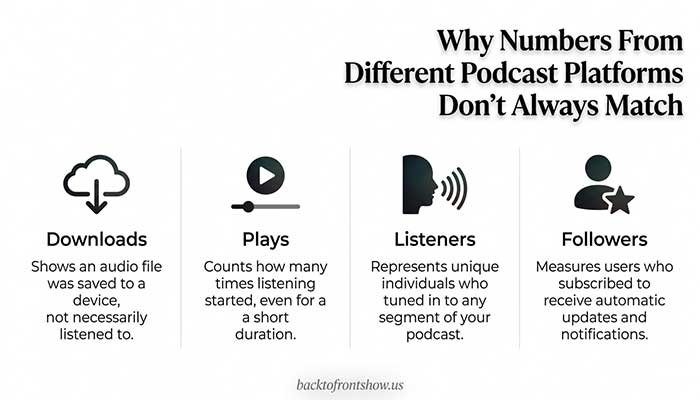
Seeing different numbers in different dashboards is normal.
Your host might report one download figure.
Apple Podcasts Connect might show a different number of listeners.
Spotify might show another number of plays.
That doesn’t necessarily mean one platform is wrong.
They may be measuring different things.
For example:
- A download is not necessarily the same as a play.
- A play is not necessarily the same as a listener.
- A listener is not necessarily a follower.
- Your host can receive requests generated across many podcast apps.
- Apple analytics describe activity measurable within Apple’s ecosystem.
- Spotify analytics describe Spotify activity, with some additional cross-platform download data available when Spotify hosts the show.
This is why I avoid combining unrelated numbers into one homemade “total audience” metric unless I’m confident the methodologies are compatible.
It can look precise while actually making your reporting less accurate.
How to Read Podcast Analytics Without Getting Overwhelmed
A beginner doesn’t need to check analytics every day.
A simple reporting routine works better.
Step 1: Pick a consistent review period
For example, review your analytics once a week or once a month.
Avoid reacting to every small daily movement.
Step 2: Track a small set of core metrics
You might start with:
- Downloads or plays
- Audience
- Followers
- Average consumption or completion
- Discovery or conversion data, if available
Step 3: Compare episodes at equal ages
Instead of lifetime totals, compare performance:
- After 24 hours
- After 7 days
- After 30 days
Pick windows appropriate for your publishing schedule.
Step 4: Add context
Write down anything unusual that happened.
For example:
- Guest appeared on another show
- Episode received newsletter promotion
- You changed the episode title format
- You released on a different day
- A social post performed unusually well
- The episode covered a timely subject
Without context, you may incorrectly attribute a spike to the episode itself.
Step 5: Look for patterns, not isolated wins
One strong episode doesn’t prove a strategy.
If interviews repeatedly outperform solo episodes across several comparable releases, that’s more meaningful.
If shorter introductions repeatedly improve early retention, that’s worth paying attention to.
Step 6: Change one important thing at a time
If possible, don’t simultaneously change your:
- Format
- Episode length
- Publishing day
- Artwork
- Titles
- Promotion strategy
and then try to determine what caused the change in performance.
You won’t know.
Make measured improvements where practical.
A Simple Podcast Analytics Report for Beginners
You don’t need complicated reporting software.
A spreadsheet can be enough.
Try tracking:
| Episode | Topic | 7-Day Downloads/Plays | 30-Day Downloads/Plays | Followers Gained | Completion/Consumption | Promotion Notes |
|---|---|---|---|---|---|---|
| Episode 1 | Topic A | — | — | — | — | Newsletter |
| Episode 2 | Topic B | — | — | — | — | Social media |
| Episode 3 | Topic C | — | — | — | — | Guest promotion |
Use the exact metrics available to you rather than forcing every podcast into this template.
After several episodes, ask:
- Which topics consistently attract more people?
- Which episodes retain attention?
- Which episodes create followers?
- Which promotions produce noticeable changes?
- Are newer episodes outperforming older episodes at the same age?
- Is the audience becoming more consistent?
Those questions turn podcast statistics into useful information.
How to Use Analytics to Improve Your Podcast
Analytics only becomes valuable when it changes what you do.
If downloads are growing but engagement is weak
You may be good at attracting attention but weaker at keeping it.
Review:
- Opening length
- Topic-to-title alignment
- Pacing
- Episode structure
- Unnecessary introductions
- Whether the episode delivers what the title promised
If retention is strong but reach is low
Your content may be satisfying the people who find it, while discovery is the bigger problem.
Consider improving:
- Promotion
- Search-friendly episode topics
- Guest collaboration
- Social distribution
- Podcast positioning
- Titles and descriptions
If impressions are high but plays are low
Focus on the decision people make before listening.
Check:
- Episode title
- Cover art
- Topic
- Description
- Show positioning
If one topic consistently wins
Don’t automatically turn your entire podcast into that topic.
Instead, test whether the pattern continues.
You could:
- Publish another episode on a related subject.
- Compare it at the same age.
- Review both reach and engagement.
- Decide whether the audience is signaling genuine demand.
If people repeatedly leave at the same type of section
Investigate the pattern.
Maybe listeners lose interest during:
- Long intros
- Housekeeping announcements
- Repetitive explanations
- Extended promotions
- Off-topic conversation
I usually recommend treating a retention drop as a clue rather than a verdict. Sometimes listeners leave for reasons completely unrelated to your content.
Repeated patterns are much more useful than a single drop.
Common Podcast Analytics Mistakes
Checking your numbers constantly
Small shows can produce large percentage swings from relatively few people.
Daily checking can create noise instead of insight.
Comparing lifetime downloads
A six-month-old episode naturally has had much more time to collect downloads than one published last week.
Use equal measurement windows.
Treating downloads as completed listens
A downloaded episode isn’t proof that someone listened all the way through.
Use listening or engagement metrics where available.
Comparing incompatible metrics
Don’t casually compare:
- Downloads from one host
- Plays from Spotify
- Apple engaged listeners
as if they’re identical measurements.
They’re not.
Chasing one high-performing episode
Outliers happen.
A celebrity guest, trending subject, external link, news event, or unexpected recommendation can temporarily change performance.
Look for repeatable patterns.
Ignoring your podcast’s goal
A niche business podcast may care more about reaching a small group of highly relevant listeners than generating the largest possible download number.
A broad entertainment show might have very different priorities.
Analytics should support the purpose of your podcast.
What Is a Good Number of Podcast Downloads?
There isn’t one download number that automatically makes a podcast successful.
“Good” depends on:
- How long the podcast has existed
- Publishing frequency
- Topic
- Target audience
- Episode age
- Marketing
- Distribution
- Your goals
- Whether you’re measuring a niche or mass-market show
A podcast created for 500 highly relevant professionals could deliver tremendous value without reaching a mass audience.
Instead of asking:
“Are my downloads good?”
Ask:
“Is my podcast moving toward the outcome I created it for?”
Then use analytics to measure that progress.
Which Podcast Metric Matters Most?
There isn’t one universal best metric.
The most important number depends on what you’re trying to improve.
If your goal is reach, examine:
- Downloads
- Plays
- Audience
- Impressions
If your goal is engagement, examine:
- Listening time
- Consumption time
- Completion
- Retention
If your goal is loyalty, examine:
- Followers
- Returning audience
- Retention
If your goal is discovery, examine:
- Impressions
- Discovery sources
- Conversion from impressions to plays
For many beginners, I’d start by combining reach + engagement + loyalty rather than choosing one number.
For example:
- Reach: 7-day downloads or plays
- Engagement: completion or consumption
- Loyalty: followers or returning audience
Together, they give you a more useful picture than any one metric alone.
A Practical Monthly Podcast Analytics Checklist
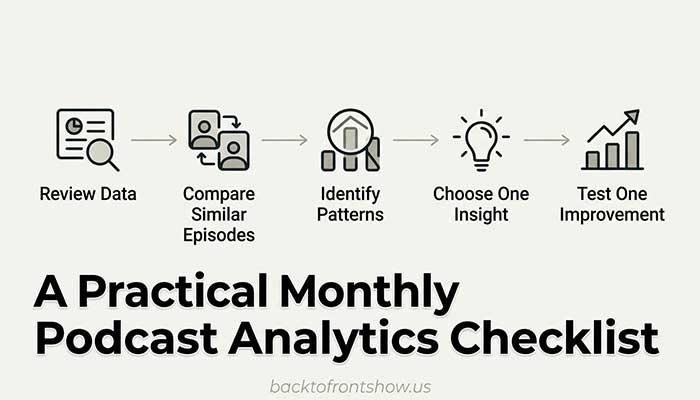
Once a month, ask:
- Did my audience grow?
- Did comparable episodes receive more or fewer downloads or plays?
- Which episode attracted the most attention?
- Which episode held attention best?
- Did followers increase?
- Which topics repeatedly perform well?
- Did any promotion produce a noticeable result?
- Are there unusual spikes or drops that need context?
- Are listeners returning?
- What is one thing I should test next month?
Then choose one or two actions.
For example:
- Test shorter episode introductions.
- Publish another episode around a high-performing topic.
- Improve episode titles.
- Increase promotion on a channel already producing results.
- Add a clearer request to follow the show.
That’s enough.
You don’t need to rebuild your podcast every month.
Final Takeaway
Podcast analytics for beginners becomes much easier once you stop treating the dashboard as a scoreboard.
The goal isn’t simply to make every number go up.
Analytics should help you understand three things:
Are people finding the podcast?
Are they actually spending time with it?
Are enough of them coming back?
Start with a few metrics, learn exactly what each platform is measuring, compare episodes fairly, and look for patterns over time.
After more than two years working with podcast-related content and analytics topics, one lesson I’ve found consistently useful is that more data isn’t automatically better. The useful part is knowing what question you’re trying to answer before opening the analytics dashboard.
When you approach the numbers that way, podcast analytics stops feeling like a collection of confusing statistics and becomes a practical tool for improving your show.